As a SAS developer, I am always looking ahead to the next release of SAS. However, many SAS customer sites migrate to new releases slowly and are just now adopting versions of SAS that were released in 2010 or 2011. Consequently, I want to write a few articles that discuss recent additions to the SAS/IML language, where "recent" goes back a few years. For the several Mondays, my "Getting Started" articles will review SAS/IML language features that were added in SAS/IML 9.22 (released in 2010) and SAS/IML 9.3 (released in 2011).
Today's topic: basic descriptive statistics for sample data. In particular, the MEAN, VAR, and STD functions.
The MEAN function: Much more than sample means
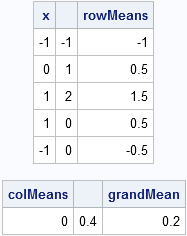
Prior to SAS/IML 9.22, statistical programmers used the colon (:) subscript reduction operator to compute the arithmetic mean of data. For example, the following SAS/IML program computes the grand mean, the row means, and the column means of data in a 5x2 matrix:
proc iml;
x = {-1 -1,
      0  1,
      1  2,
      1  0,
     -1  0 };

rowMeans = x[ ,:];
colMeans = x[:, ];
grandMean= x[:];
print x rowMeans, colMeans grandMean; |
The MEAN function was introduced in SAS/IML 9.22. The expression mean(x) computes the arithmetic mean of each column of a matrix. It is equivalent to x[:,]. The MEAN function also supports trimmed and Winsorized means, which are robust estimators of location.
Because the MEAN function computes the arithmetic mean of each column of a matrix, you need to be careful when computing the mean of a vector. Make sure that the function argument it is a column vector, not a row vector. For example, the following statement does NOT compute the mean of the elements in the vector, g:
g = 1:5;     /* row vector {1 2 3 4 5} */
m = mean(g); /* probably not what you want! */ |
Instead, use the transpose function (T) or the COLVEC function so that the argument to the MEAN function is a column vector:
m = mean(colvec(g)); /* correct */ |
A previous article discusses the trimmed and Winsorized means and provides an example.
The VAR function for computing the sample variance
Prior to SAS/IML 9.22, statistical programmers could use a module to compute the sample variance of each column of a matrix. The VAR function is more efficient, but the results are the same. The following statement computes the sample variance of each column of x:
v = var(x); print v; |

If you compute the variance of data in a vector, make sure that you pass a column vector to the VAR function.
The STD function for computing the sample standard deviation
The STD function (introduced in SAS 9.3) is simply the square root of the sample variance. As such, the STD function is merely a convenient shortcut for sqrt(var(x)):
s = std(x); print s; |

Once again, if you compute the standard deviation of data in a vector, make sure that you pass a column vector to the STD function.

11 Comments
Hi Rick,
You show the calculation of the variance for each column of a matrix.
If we need to calculate the value of the variance for all elements of the matrix, how we can do that?
The easiest way is to use the COLVEC function to create a column vector and then use VAR to compute the variance:
v = var( colvec(M) );
I appreciate your help.
Hello Rick,
I tried to caculate MLEs for data generated from two-parameter Weibull distribution iside do loop using call nlptr(rc,xres,"f_weib2",x0,optn,con,,,,"g_weib2"); and also keep one of the MLEs in a matrix.
The program could not be run and I got the following warnings and erreor messages:
WARNING: Starting a module while inside a DO group.
WARNING: Finishing a module while inside a DO group.
ERROR: DO expression not given value.
ERROR: Execution error as noted previously. (rc=1052)
What should I do to solve this problem? Your help is much appreciated.
Best Regards,
Amany
You can ask programming questions at the SAS Support Community for SAS/IML. Including your program and any data helps people diagnose the issue. For error messages, the SAS log is also helpful.
I need to write code where in by using demand file (DMD0, DMD1, DMD2) by using these months demand I need to identify highest demand from 24 months demand. could you please help how to code it.
Yes, you can get all of your SAS questions answered by posting to the SAS Support Communities. Provide sample data and desired output whenever possible.
Hi Rick,
I have 10 columns in my dataset, 3 of which are like classification variables , I need to populate 2 new columns with the mean and std dev of the 4 of the remaining 7 numerical columns respectively. Each row in column 11 and 12 giving me the mean and std dev of the values in the corresponding columns 4-7.
Is there a way I can pass information as to which columns to consider while calculating mean?
You can ask SAS programming questions on the SAS Support Communities. Did you look up the MEAN and STD functions in the Base SAS doc? You can specify the 4 variables on an ARRAY stmt and then use the OF keyword in the MEAN and STD function. Or you can just specify the variable names in the functions.
Can variance be negative in IML procedure? Can you give me with example?
The variance is never negative. The variance of univariate data is calculated by using the sum of squares from the mean value, so it is always positive (or zero, if the data are identical).