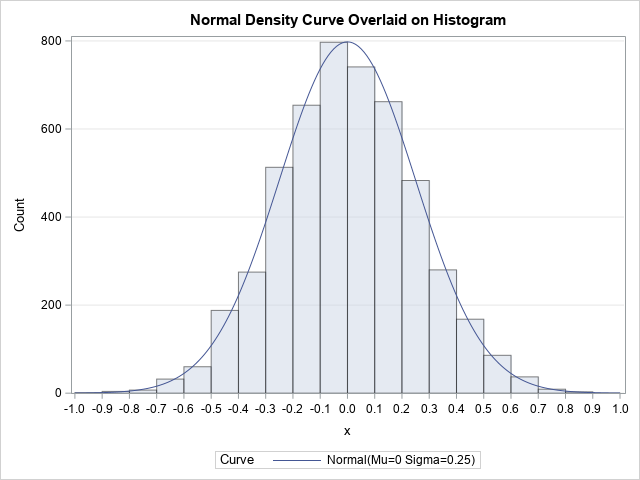
When you create a histogram with statistical software, the software uses the data (including the sample size) to automatically choose the width and location of the histogram bins. The resulting histogram is an attempt to balance statistical considerations, such as estimating the underlying density, and "human considerations," such as choosing
Author
My wife got one of those electronic activity trackers a few months ago and has been diligently walking every day since then. At the end of the day she sometimes reads off how many steps she walked, as measured by her activity tracker. I am always impressed at how many
In a previous blog post, I showed how to use the graph template language (GTL) in SAS to create heat maps with a continuous color ramp. SAS/IML 13.1 includes the HEATMAPCONT subroutine, which makes it easy to create heat maps with continuous color ramps from SAS/IML matrices. Typical usage includes
Heat maps have many uses. In a previous article, I showed how to use heat maps with a discrete color ramp to visualize matrices that have a small number of unique values, such as certain covariance matrices and sparse matrices. You can also use heat maps with a continuous color
One of the things I enjoy about blogging is that I often learn something new. Last week I wrote about how to optimize a function that is defined in terms of an integral. While developing the program in the article, I made some mistakes that generated SAS/IML error messages. By
A SAS customer wrote, "I have access to PROC IML through SAS OnDemand for Academics. What is the best way for me to learn to program in the SAS/IML language? How do I get started with PROC IML?" That is an excellent question, and I'm happy to offer some suggestions.
The SAS/IML language is used for many kinds of computations, but three important numerical tasks are integration, optimization, and root finding. Recently a SAS customer asked for help with a problem that involved all three tasks. The customer had an objective function that was defined in terms of an integral.
Wisdom has built her house; She has hewn out her seven pillars. – Proverbs 9:1 At the 2014 Joint Statistical Meetings in Boston, Stephen Stigler gave the ASA President's Invited Address. In forty short minutes, Stigler laid out his response to the age-old question "What is statistics?" His answer was
In SAS software, you can use the QUAD subroutine in the SAS/IML language to evaluate definite integrals on an interval [a, b]. The integral is properly defined only for a < b, but mathematicians define the following convention, which enables you to make sense of reversing the limits of integration:
Unless you diligently read the "What's New" chapter for each release of SAS software, it is easy to miss new features that appear in the language. People who have been writing SAS/IML programs for decades are sometimes surprised when I tell them about a useful new function or programming feature.
In a previous blog post, I described how to generate combinations in SAS by using the ALLCOMB function in SAS/IML software. The ALLCOMB function in Base SAS is the equivalent function for DATA step programmers. Recall that a combination is a unique arrangement of k elements chosen from a set
In a previous blog post, I showed how to overlay a prediction ellipse on a scatter plot in SAS by using the ELLIPSE statement in PROC SGPLOT. The ELLIPSE statement draws the ellipse by using a standard technique that assumes the sample is bivariate normal. Today's article describes the technique
It is common in statistical graphics to overlay a prediction ellipse on a scatter plot. This article describes two easy ways to overlay prediction ellipses on a scatter plot by using SAS software. It also describes how to overlay multiple prediction ellipses for subpopulations. What is a prediction ellipse? A
An empty matrix is a matrix that has zero rows and zero columns. At first "empty matrix" sounds like an oxymoron, but when programming in a matrix language such as SAS/IML, empty matrices arise surprisingly often. Sometimes empty matrices occur because of a typographical error in your program. If you
Have you written a SAS/IML program that you think is particularly clever? Are you the proud author of SAS/IML functions that extend the functionality of SAS software? You've worked hard to develop, debug, and test your program, so why not share it with others? There is now a location for
In my four years of blogging, the post that has generated the most comments is "How to handle negative values in log transformations." Many people have written to describe data that contain negative values and to ask for advice about how to log-transform the data. Today I describe a transformation
In my previous blog post, I showed how to use log axes on a scatter plot in SAS to better visualize data that range over several orders of magnitude. Because the data contained counts (some of which were zero), I used a custom transformation x → log10(x+1) to visualize the
If you are trying to visualize numerical data that range over several magnitudes, conventional wisdom says that a log transformation of the data can often result in a better visualization. This article shows several ways to create a scatter plot with logarithmic axes in SAS and discusses some of the
A few years ago I blogged about how to expand a data set by using a frequency variable. The DATA step in the article was simple, but the SAS/IML function was somewhat complicated and used a DO loop to expand the data. (Although a reader later showed how to avoid
A SAS customer showed me a SAS/IML program that he had obtained from a book. The program was taking a long time to run on his data, which was somewhat large. He was wondering if I could identify any inefficiencies in the program. The first thing I did was to
Last week I showed how to use the SUBMIT and ENDSUBMIT statements in the SAS/IML language to call the SGPLOT procedure to create ODS graphs of data that are in SAS/IML vectors and matrices. I also showed how to create a SAS/IML module that hides the details and enables you
My last blog post showed how to simulate data for a logistic regression model with two continuous variables. To keep the discussion simple, I simulated a single sample with N observations. However, to obtain the sampling distribution of statistics, you need to generate many samples from the same logistic model.
In my book Simulating Data with SAS, I show how to use the SAS DATA step to simulate data from a logistic regression model. Recently there have been discussions on the SAS/IML Support Community about simulating logistic data by using the SAS/IML language. This article describes how to efficiently simulate
As you develop a program in the SAS/IML language, it is often useful to create graphs to visualize intermediate results. The language supports basic statistical graphics such as bar charts, histograms, scatter plots, and so on. However, you can create more advanced graphics without leaving PROC IML by using the
A colleague asked me an interesting question: I have a journal article that includes sample quantiles for a variable. Given a new data value, I want to approximate its quantile. I also want to simulate data from the distribution of the published data. Is that possible? This situation is common.
I've pointed out in the past that in the SAS/IML language matrices are passed to modules "by reference." This means that large matrices are not copied in and out of modules but are updated "in place." As a result, the SAS/IML language can be very efficient when it computes with
Today is my 500th blog post for The DO Loop. I decided to celebrate by doing what I always do: discuss a statistical problem and show how to solve it by writing a program in SAS. Two ways to parameterize the lognormal distribution I recently blogged about the relationship between
Nonlinear optimization routines enable you to find the values of variables that optimize an objective function of those variables. When you use a numerical optimization routine, you need to provide an initial guess, often called a "starting point" for the algorithm. Optimization routines iteratively improve the initial guess in an
In many areas of statistics, it is convenient to be able to easily construct a uniform grid of points. You can use a grid of parameter values to visualize functions and to get a rough feel for how an objective function in an optimization problem depends on the parameters. And
In my book Simulating Data with SAS, I specify how to generate lognormal data with a shape and scale parameter. The method is simple: you use the RAND function to generate X ~ N(μ, σ), then compute Y = exp(X). The random variable Y is lognormally distributed with parameters μ