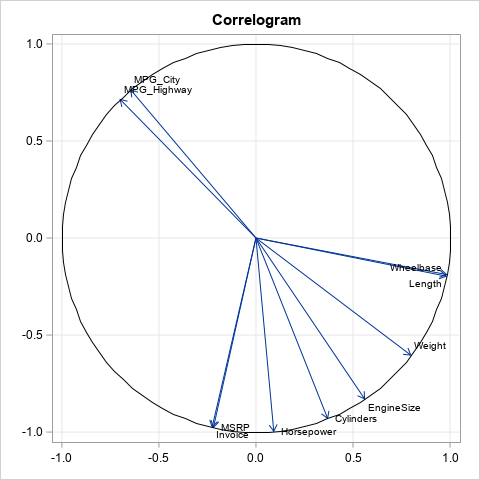
In my book Simulating Data with SAS, I show how to use the SAS DATA step to simulate data from a logistic regression model. Recently there have been discussions on the SAS/IML Support Community about simulating logistic data by using the SAS/IML language. This article describes how to efficiently simulate
Author
As you develop a program in the SAS/IML language, it is often useful to create graphs to visualize intermediate results. The language supports basic statistical graphics such as bar charts, histograms, scatter plots, and so on. However, you can create more advanced graphics without leaving PROC IML by using the
A colleague asked me an interesting question: I have a journal article that includes sample quantiles for a variable. Given a new data value, I want to approximate its quantile. I also want to simulate data from the distribution of the published data. Is that possible? This situation is common.
I've pointed out in the past that in the SAS/IML language matrices are passed to modules "by reference." This means that large matrices are not copied in and out of modules but are updated "in place." As a result, the SAS/IML language can be very efficient when it computes with
Today is my 500th blog post for The DO Loop. I decided to celebrate by doing what I always do: discuss a statistical problem and show how to solve it by writing a program in SAS. Two ways to parameterize the lognormal distribution I recently blogged about the relationship between
Nonlinear optimization routines enable you to find the values of variables that optimize an objective function of those variables. When you use a numerical optimization routine, you need to provide an initial guess, often called a "starting point" for the algorithm. Optimization routines iteratively improve the initial guess in an
In many areas of statistics, it is convenient to be able to easily construct a uniform grid of points. You can use a grid of parameter values to visualize functions and to get a rough feel for how an objective function in an optimization problem depends on the parameters. And
In my book Simulating Data with SAS, I specify how to generate lognormal data with a shape and scale parameter. The method is simple: you use the RAND function to generate X ~ N(μ, σ), then compute Y = exp(X). The random variable Y is lognormally distributed with parameters μ
Sometimes you have data in SAS/IML vectors that you need to write to a SAS data set. By default, no formats are associated with the variables that you create from SAS/IML vectors. However, some variables (notably dates, times, and datetimes) should have formats associated with the data values. You can
Bootstrap methods and permutation tests are popular and powerful nonparametric methods for testing hypotheses and approximating the sampling distribution of a statistic. I have described a SAS/IML implementation of a bootstrap permutation test for matched pairs of data (an alternative to a matched-pair t test) in my paper "Modern Data
A little-known but useful feature of SAS/IML 12.3 (which was released with SAS 9.4) is the ability to generate a vector of lowercase or uppercase letters by using the colon operator (:). Many SAS/IML programmers use the colon operator to generate a vector of sequential integers: proc iml; x =
In a previous post, I stated that you should avoid matrix multiplication that involves a huge diagonal matrix because that operation can be carried out more efficiently. Here's another tip that sometimes improves the efficiency of matrix multiplication: use parentheses to prevent the creation of large matrices. Matrix multiplication is
I love working with SAS Technical Support because I get to see real problems that SAS customers face as they use SAS/IML software. The other day I advised a customer how to improve the efficiency of a computation that involved multiplying large matrices. In this article I describe an important
Last week, as part of an article on how spammers generate comments for blogs, I showed how to generate random messages by using the CATX function in the DATA step. In that example, the strings were scalar quantities, but you can also concatenate vectors of strings in the SAS/IML language.
In my recent post on how to understand character vectors in SAS/IML, I left out an important topic: How can you allocate a character vector of a specified length? In this article, "length" means the maximum number of characters in an element, not the number of elements in a vector.
Last week Chris Hemedinger posted an article about spam that is sent to SAS blogs and discussed how anti-spam software helps to block spam. No algorithm can be 100% accurate at distinguishing spam from valid comments because of the inherent trade-off between specificity and sensitivity in any statistical test. Therefore,
SAS programmers are probably familiar with how SAS stores a character variable in a data set, but how is a character vector stored in the SAS/IML language? Recall that a character variable is stored by using a fixed-width storage structure. In the SAS DATA step, the maximum number of characters
While at a conference recently, I was asked whether it was possible to use SAS to simulate data from an inverse gamma distribution. The SAS customer had looked at the documentation for the RAND function and did not see "inverse gamma" listed among the possible choices. The answer is "yes."
Dear Rick, I am trying to create a numerical matrix with 100,000 rows and columns in PROC IML. I get the following error: (execution) Unable to allocate sufficient memory. Can IML allocate a matrix of this size? What is wrong? Several times a month I see a variation of this
Just one last short article about properties of the Hilbert matrix. I've already blogged about how to construct a Hilbert matrix in the SAS/IML language and how to compute a formula for the determinant. One reason that the Hilbert matrix is a famous (some would say infamous!) example in numerical
I have previously written about the scope of local and global variables in the SAS/IML language. You might wonder whether SAS/IML modules can also have local scope. The answer is no. All SAS/IML modules are known globally and can be called by any other modules. Some object-oriented programming languages support
Last week I described the Hilbert matrix of size n, which is a famous square matrix in numerical linear algebra. It is famous partially because its inverse and its determinant have explicit formulas (that is, we know them exactly), but mainly because the matrix is ill-conditioned for moderate values of
I enjoy blogging about new functionality in the SAS/IML language because I can go into more depth and provide more complicated examples than the SAS/IML documentation. Today's article is a summary of all of my posts about features that were added to SAS/IML 12.1, which shipped in August 2012 as
Yesterday I blogged about the Hilbert matrix. The (i,j)th element of the Hilbert matrix has the value 1 / (i+j-1), which is the reciprocal of an integer. However, the printed Hilbert matrix did not look exactly like the formula because the elements print as finite-precision decimals. For example, the last
The Hilbert matrix is the most famous ill-conditioned matrix in numerical linear algebra. It is often used in matrix computations to illustrate problems that arise when you compute with ill-conditioned matrices. The Hilbert matrix is symmetric and positive definite, properties that are often associated with "nice" and "tame" matrices. The
I enjoy reading the Graphically Speaking blog because it teaches me a lot about ODS statistical graphics, especially features of the SGPLOT procedure and the Graph Template Language (GTL). Yesterday Sanjay blogged about how to construct a stacked bar chart of percentages so that each bar represents 100%. His chart
Did you know that SAS/IML 12.1 provides built-in functions that compute the norm of a vector or matrix? A vector norm enables you to compute the length of a vector or the distance between two vectors in SAS. Matrix norms are used in numerical linear algebra to estimate the condition
While at SAS Global Forum 2014 I attended a talk by Jorge G. Morel on the analysis of data with overdispersion. (His slides are available, along with a video of his presentation.) The Wikipedia defines overdispersion as "greater variability than expected from a simple model." For count data, the "simple
When spontaneous applause broke out during Dr. Jim Goodnight's presentation at the opening session of SAS Global Forum 2014, I was one of the people cheering the loudest. The SAS CEO had just announced free software for students and professors at universities around the world. The SAS University Edition will
SAS Global Forum 2014, included a meetup of SAS users who are active in various online communities. During the meetup I was struck by the tremendous opportunities that these communities provide. All year long, the online communities demonstrate the conference theme: "the potential of one, the power of all." This