In many areas of statistics, it is convenient to be able to easily construct a uniform grid of points. You can use a grid of parameter values to visualize functions and to get a rough feel for how an objective function in an optimization problem depends on the parameters. And of course, grids are used to construct a full factorial design, which is an experimental design in which every setting of every factor appears with every setting of every other factor. I have previously blogged about how to generate two-dimensional grids in SAS, but this article describes how to generate grids with more dimensions.
In the SAS DATA step, you can create a grid of points by writing nested DO loops. For example, suppose that there are three factors: X with discrete values {–2, –1, 0, 1, 2}, Y with values {–1, 0, 1}, and Z with values {–1, 1}. The following DATA step creates data for each combination of the three factors:
data grid; do x = -2 to 2; do y = -1 to 1; do z = -1, 1; output; end; end; end; run; proc print data=grid; run; |
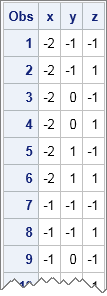
In this data set, the Z variable changes the fastest and the X variable changes the slowest as you read through the observations. This corresponds to the fact that the Z variable is the innermost of the nested DO loops in the DATA step. By changing the order of the DO loops, you can change which variable varies the fastest. The data set contains 5*3*2 = 30 observations, and each observation is a unique combination of the levels of the three variables.
In the DATA step, a grid that involves k variables requires k nested DO loops. In a matrix language such as SAS/IML, vector operations and calls to built-in functions are more efficient than DO loops. In SAS/IML 12.3 (released with SAS 9.4), you can use a single call to the EXPANDGRID function to generate a grid of points for up to 15 variables. The following SAS/IML program creates a matrix with three columns and 30 rows. The values of the matrix are identical to the values that are generated by the DATA step. In particular, the first variable changes the slowest and the last variable changes the fastest as you move down the rows of the matrix.
proc iml;
/* varies  SLOW <-----------------> FAST */
/* values for    x       y       z      */
m = expandgrid(-2:2, -1:1, {-1 1}); |
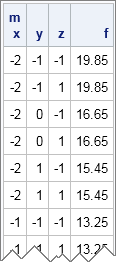
The EXPANDGRID function is very useful. If you have a function of k variables, each row of m is a valid ordered k-tuple for the function. (k = 3 for this example.) If you evaluate the function at each point of the grid, you obtain a grid of function values. This enables you to obtain a feeling for where the function is large and where it is small within the range of the grid. For example, the following statements define the mulitvariate quadratic function f(x) = (x-1.8)2 + (y-1.1)2 + z2 and evaluates the function at each of the points that make up the 30 rows of m:
start Func(x);
   return( (x[,1]-1.8)##2 + (x[,2]-1.1)##2 + x[,3]##2 );
finish;

f = Func(m);
print m[c={"x" "y" "z"}] f; |
You can use the EXPANDGRID function in many ways. When k equals 2 or 3, you can visualize a function by evaluating it on a uniform grid of points and plotting the result. When performing nonlinear optimization, you can use the EXPANDGRID function to obtain an initial guess for the optimal parameter value. I will demonstrate these techniques in my next blog post.

7 Comments
Pingback: How to find an initial guess for an optimization - The DO Loop
Pingback: Overview of new features in SAS/IML 12.3 - The DO Loop
Pingback: Mathematical art: Weaving matrices - The DO Loop
Pingback: Creating a matrix with all combinations of zeros and ones - The DO Loop
Pingback: Grids and linear subspaces - The DO Loop
Pingback: Creating a matrix with all combinations of zeros and ones - SAS Blogs
Pingback: How to create a grid of values? - The DO Loop