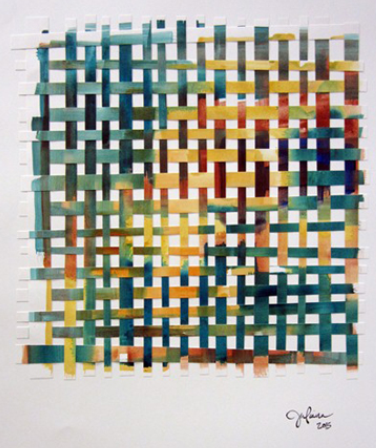
An artist friend of mine recently created a beautiful abstract image and described the process on her blog. She says that "after painting my initial square, I cut it into strips and split them down the middle, then wove them together.... I had no idea when I started piecing these together again what they would look like."
I marveled at the beauty of the finished result, but I also started thinking about the process of constructing the artwork. You cut an initial picture into n vertical strips. (For simplicity, assume that n is even.) Then you take the first n/2 strips and space them out so that there are gaps between them. You take the last n/2 strips and turn them sideways, weaving them in and out of the vertical strips.
As my friend said in a private communication, the final image "depends entirely on the arrangement of the elements.... There are so many versions of the final outcome." By this she means that the process is deterministic, although the artist can make choices regarding the number of strips, the orientation of the strips, and the weaving pattern. Yes, it is difficult to predict the final image while staring at the initial image, but this is the sort of algorithm that you could ask a computer to carry out.
So, of course, I had to learn to make images like this with SAS!
Weaving matrices
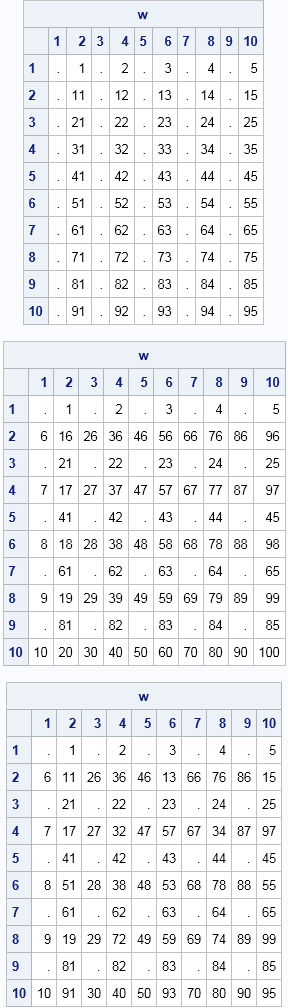
To make sure that I understood the algorithm, I started with a 10 x 10 numeric matrix X that contains the values 1–100 in row-major order. That is, the first row contains 1–10, the second row contains 11–20, and so forth. I then created a 10 x 10 matrix W (for "weave") that contained all missing values. I copied the first five columns of X into the even columns of W. I then copied the last five columns of X into the even rows of W. I then went back and "wove" the columns and rows by re-copying certain elements from the first five columns of X. You can view this construction process for an example matrix.
The process can be encapsulated into a SAS/IML function, which is shown below:
proc iml; start weave(x); n = nrow(x); /* n must be even */ y = j(n, n, .); j = 1:n/2; /* vertical strips */ y[, 2*j] = x[, j]; /* copy to every other column */ i = (n/2+1):n; /* horizontal strips */ y[2*i-n,] = x[, i]`; /* copy to every other row */ k = do(1, n/2, 2); /* weaving: raise certain rows */ y[2*k, 2*k] = x[2*k, k]; /* every other for even rows */ k = do(2, n/2, 2); y[2*k, 2*k] = x[2*k,k]; /* every other for odd rows */ return( y ); finish; x = shape(1:100, 10); /* original 10x10 matrix */ w = weave(x); print w; |
Weaving heat maps
Now the fun can begin. Recall that a heat map is essentially a visualization of a matrix of numbers. A heat map can be used to visualize mathematical functions of two variables, and you can use the HEATMAPCONT function in SAS/IML 13.1 to easily create a heat map.
You can use the EXPANDGRID function to define a grid of evenly spaced points in the square [-1, 1] x [-1, 1]. You can evaluate a mathematical function on the grid and reshape the results into a matrix. You can then create a heat map of the original function and the "weave" of the function. For details, you can download the complete SAS/IML program that I used to construct the images in this article.
For example, in the following image, the function on the left is f(x,y) = x. The heat map that visualizes the function shows that the function is constant on vertical strips. You can see that each strip is a constant color, and the image on the right has taken those strips and woven them together.

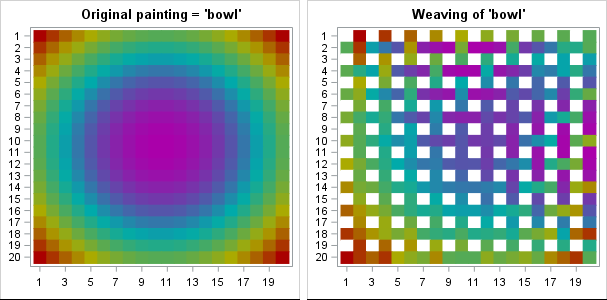
The woven image is beautiful, but you can make more interesting images by choosing more interesting functions to use as the original image. The left portion of the following image shows a heat map for the quadratic function f(x,y) = x2 + y2. The image on the right is formed by weaving the vertical strips from the left image.
You get the idea: You can visualize any mathematical function and then form "mathematical art" by cutting the function along strips and weaving the strips back together.
If you are adventurous, you can play with different color palettes for the images. I chose a muted rainbow palette, but you can experiment with other color ramps. The program for these examples include other color ramps that change the aesthetics of the images.
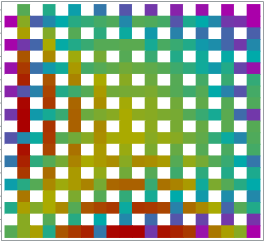
I'll leave you with one more image. It is the weave for a common function from multivariable calculus. Can you deduce the original image from the weave? If not, look in the program that creates these examples..
These images show flexibility of the SAS/IML language for creating a custom algorithm. These simple images lack the depth and complexity of "real" art, but they show how matrices can be used to illustrate the main ideas behind a simple artistic process.
Try it yourself! What images can you make? If you create an interesting picture, leave a comment that includes the mathematical formula.

3 Comments
Pingback: Mathematical art (part 2): Unweaving matrices - The DO Loop
How about a Hadamard Tiling! Here each tile is a Hadamard matrix that has been superimposed on itself 4 times, but each time rotated by 90 degrees. Kind of curious how the matrix e has only two values, this is not true for some other orders I have tried.
.
start Rot90(m); /* from Rick's blog */
return( T(m[,ncol(m):1]) );
finish;
a = hadamard(36);
b = Rot90(a);
c = Rot90(b);
d = Rot90(c);
e = a + b + c + d;
t = repeat( e[2:35, 2:35], 12, 12); /* strip the borders and tile */
ods graphics / width=600px height=600px;
run HeatmapDisc(t) colorramp = palette("PIYG", 4) displayoutlines = 0;
Pretty!