In my previous blog post, I showed how you can use SAS to program a "weaving" algorithm that takes an image, cuts it into strips, and weaves the strips together to create mathematical art. I used matrices and heat maps for the computations and visualization.
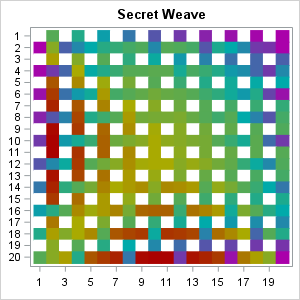
At the end of the post, I presented an image of woven strips (shown at left) and challenged the reader to "deduce the original image from the weave." This article shows that you can "unweave" the image, reassemble the strips, and use interpolation to obtain an approximation to the original image. You can download the SAS/IML program that computes and visualizes the preimage.
Unweaving a weave
The first step in reconstructing the original image is to "pull apart" the horizontal and vertical strips, rotate the horizontal ones, put them next to the vertical strips, and close all the gaps. This requires writing the inverse of the weave algorithm. When you do this, you obtain the following image:
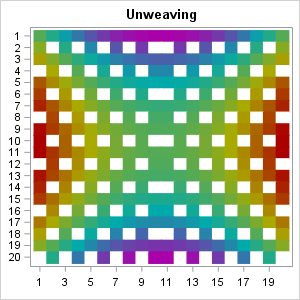
Notice that there are gaps in our knowledge about the original image. Due to the weaving process, there are places where a vertical strip was covered by a horizontal strip, or the other way around. These missing values are shown in white. Mathematically, the weaving algorithm represents a many-to-one function, so there is no inverse function that can restore the preimage from the image.
Nevertheless, the unweaving reveals the main features of the original image. And we can do more. If we know that the original image was created from a continuous mathematical function, you can use interpolation to try to fill in the gaps. For this image you can use the information from nearby cells (north, south, east, and west) to estimate a value for the missing cells. The following uses a simple estimation scheme, which is to assign each missing cell the average value of its neighbors. You can proceed in five steps:
- Approximate the corners. For the lower left corner, use the average of the cell above and the cell to the right. For the lower right corner, use the average of the cell above and the cell to the left.
- Approximate the left edge. For each missing cell, average the cells above, below, and to the right.
- Approximate the right edge. For each missing cell, average the cells above, below, and to the left.
- Approximate the bottom edge. For each missing cell, average the cells above, to the left, and to the right.
- Approximate the interior cells. For each missing cell, average the cells above, below, to the left, and to the right.
After implementing this process, you obtain the following image, which approximates the original image:
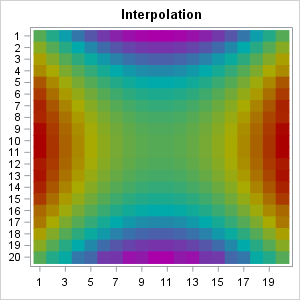
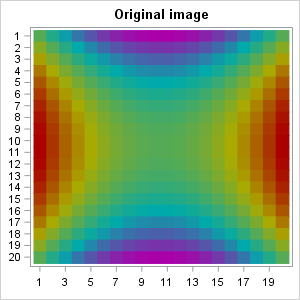
How well does this image approximate the original image? Very well! The mean square error is very small, and the maximum error values are within 20% of the true values. For comparison, here is the original image. You can see that it is very similar to the reconstructed image.
The approximation could be improved by using a more sophisticated interpolation scheme, such as bivariate linear interpolation.
Feel free to download the SAS/IML program and play with other weaves. How well can you recover an original image from its weave?