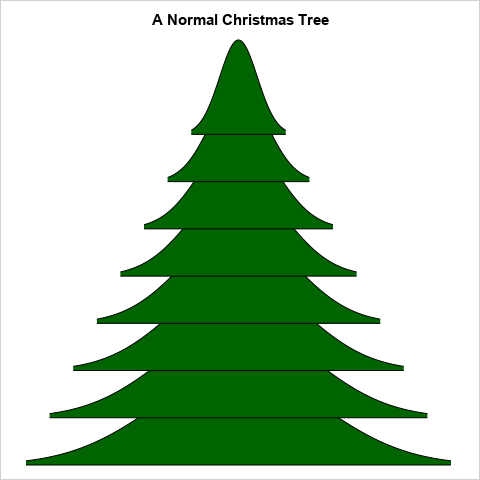
Author

Rick Wicklin
RSS
Distinguished Researcher in Computational Statistics

Rick Wicklin, PhD, is a distinguished researcher in computational statistics at SAS and is a principal developer of SAS/IML software. His areas of expertise include computational statistics, simulation, statistical graphics, and modern methods in statistical data analysis. Rick is author of the books Statistical Programming with SAS/IML Software and Simulating Data with SAS.

Rick Wicklin 0
The contaminated normal distribution

How can you generate data that contains outliers in a simulation study? The contaminated normal distribution is a simple but useful distribution you can use to simulate outliers. The distribution is easy to explain and understand, and it is also easy to implement in SAS. What is a contaminated normal

Learn SAS
Rick Wicklin 0
Solve linear programming problems in SAS

In some applications, you need to optimize a linear objective function of many variables, subject to linear constraints. Solving this problem is called linear programming or linear optimization. This article shows two ways to solve linear programming problems in SAS: You can use the OPTMODEL procedure in SAS/OR software or

Rick Wicklin 0
Animate snowfall in SAS

Out of the bosom of the Air,     Out of the cloud-folds of her garments shaken, Over the woodlands brown and bare,     Over the harvest-fields forsaken,         Silent, and soft, and slow         Descends the snow. "Snow-flakes" by Henry Wadsworth Longfellow Happy holidays to all my readers! In my last post I showed

Rick Wicklin 0
Create a Koch snowflake with SAS

I have a fondness for fractals. In previous articles, I've used SAS to create some of my favorite fractals, including a fractal Christmas tree and the "devil's staircase" (Cantor ) function. Because winter is almost here, I think it is time to construct the Koch snowflake fractal in SAS. A

Rick Wicklin 0
Discover power laws by log-transforming data

A recent issue of Astronomy magazine mentioned Kepler's third law of planetary motion, which states "the square of a planet's orbital period is proportional to the cube of its average distance from the Sun" (Astronomy, Dec 2016, p. 17). The article included a graph (shown at the right) that shows

Rick Wicklin 0
Append data to add markers to SAS graphs

Do you want to create customized SAS graphs by using PROC SGPLOT and the other ODS graphics procedures? An essential skill that you need to learn is how to merge, join, append, and concatenate SAS data sets that come from different sources. The SAS statistical graphics procedures (SG procedures) enable

Rick Wicklin 0
Sampling variation in small random samples

Somewhere in my past I encountered a panel of histograms for small random samples of normal data. I can't remember the source, but it might have been from John Tukey or William Cleveland. The point of the panel was to emphasize that (because of sampling variation) a small random sample

Rick Wicklin 0
Highlight forecast regions in graphs

A SAS customer asked how to use background colors and a dashed line to emphasize the forecast region for a graph that shows a time series model. The task requires the following steps: Use the ATTRPRIORITY=NONE option on the ODS GRAPHICS statement to make sure that the current ODS style

Rick Wicklin 0
Visualize the ages of US presidents

Who was the oldest person elected president of the United States? How about the youngest? Who was the oldest when he left office? Let's look at some data. Wikipedia has a page that presents a table of the presidents of the US by age. It lists the dates for which

Rick Wicklin 0
Visualize a torus in SAS

This article uses graphical techniques to visualize one of my favorite geometric objects: the surface of a three-dimensional torus. Along the way, this article demonstrates techniques that are useful for visualizing more mundane 3-D point clouds that arise in statistical data analysis. Define points on a torus A torus is

Rick Wicklin 0
Rotation matrices and 3-D data

Rotation matrices are used in computer graphics and in statistical analyses. A rotation matrix is especially easy to implement in a matrix language such as the SAS Interactive Matrix Language (SAS/IML). This article shows how to implement three-dimensional rotation matrices and use them to rotate a 3-D point cloud. Define

Rick Wicklin 0
Create patterns of missing data

When simulating data or testing algorithms, it is useful to be able to generate patterns of missing data. This article shows how to generate random and systematic patterns of missing values. In other words, this article shows how to replace nonmissing data with missing data. Generate a random pattern of

Advanced Analytics
Rick Wicklin 0
Loess regression in SAS/IML

A previous post discusses how the loess regression algorithm is implemented in SAS. The LOESS procedure in SAS/STAT software provides the data analyst with options to control the loess algorithm and fit nonparametric smoothing curves through points in a scatter plot. Although PROC LOESS satisfies 99.99% of SAS users who

Rick Wicklin 0
What is loess regression?

Loess regression is a nonparametric technique that uses local weighted regression to fit a smooth curve through points in a scatter plot. Loess curves are can reveal trends and cycles in data that might be difficult to model with a parametric curve. Loess regression is one of several algorithms in

Rick Wicklin 0
The empty-space distance plot

How far away is the nearest hospital? How far is the nearest restaurant? The nearest gas station? These are commonly asked questions whose answers depend on the location of the person asking the question. Recently I showed an algorithm that enables you to find the distance between a set of

Rick Wicklin 0
Visualize a weighted regression

What is weighted regression? How does it differ from ordinary (unweighted) regression? This article describes how to compute and score weighted regression models. Visualize a weighted regression Technically, an "unweighted" regression should be called an "equally weighted " regression since each ordinary least squares (OLS) regression weights each observation equally.

Rick Wicklin 0
Let PROC FREQ create graphs of your two-way tables

The recent releases of SAS 9.4 have featured major enhancements to the ODS statistical graphics procedures such as PROC SGPLOT. In fact, PROC SGPLOT (and the underlying Graph Template Language (GTL)) are so versatile and powerful that you might forget to consider whether you can create a graph automatically by

Rick Wicklin 0
Create an ogive in SAS

My son is taking an AP Statistics course in high school this year. AP Statistics is one of the fastest-growing AP courses, so I welcome the chance to see topics and techniques in the course. Last week I was pleased to see that they teach data exploration techniques, such as

1 23 24 25 26 27 51