All Posts
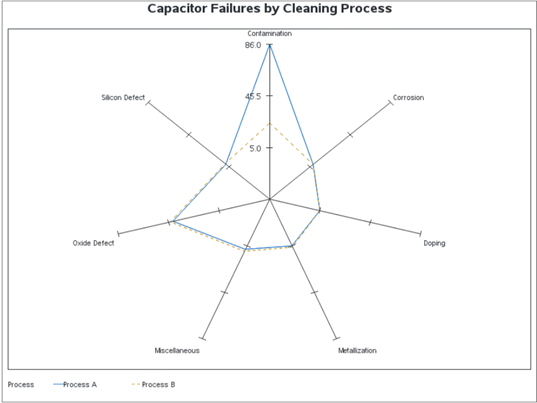

In the first of a two-part series, SAS' Cindy Wang shows you how to create a radar chart in SAS Visual Analytics using custom graph capabilities.


Recently, we sat down with Jakob Koziel, Senior Research Analyst at Bissell Centre. During their conversation, Jakob highlighted some of the work Bissell Centre is doing to eradicate poverty in Edmonton and how SAS is helping them move their mission forward. Question: Give me a little bit of background on


The extreme temperatures that hit the UK in 2022 – the heatwaves of the summer followed by cold snaps in winter – were a reminder that the climate is becoming increasingly volatile. Globally, the weather conditions were even more challenging, with droughts, famines, wildfires, flooding, and hurricanes reported worldwide. All


Can you imagine a world where Medicaid isn’t just a lifeline for those in need but a force driving outcomes that transform lives? That vision is no longer a distant dream; it’s a reality that demands our attention. Medicaid programs make thousands of policy decisions each year that affect some


For another year, multiple golf teams from Historically Black Colleges and Universities (HBCUs) across the United States gathered in Cary, NC for the SAS HBCU Invitational Tournament. The tournament was part of the SAS Championship, a week-long event filled with networking, fun and golf. As part of the event, 16


Across a wide variety of industries, SAS users are leaning into the power of data to glean relevant insights and identify new opportunities. Through analytics, they are solving complex problems, discovering practical insights, and making a difference in their fields and communities. How can others join their efforts and use
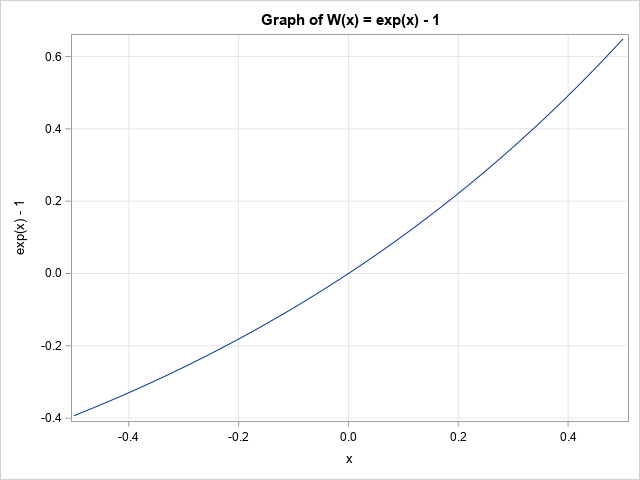

Recently I wrote about numerical analysis problem: the accurate computation of log(1+x) when x is close to 0. A naive computation of log(1+x) loses accuracy if you call the LOG function, which is why the SAS language provides the built-in LOG1PX for this computation. In addition, I showed that you


En el último año se ha observado la llegada de nuevos inversores extranjeros a México, sobre todo por la parte de la industria manufacturera, que ha traído consigo crecimiento económico para el país. De acuerdo con datos de la Asociación para la Tecnología de Manufactura (AMT, por sus siglas en


The world’s largest rugby tournament returns for the knockout stages. This blog post explores how probability and simulation can be used to predict likely winners in each of the knockout stages. Team sports are dynamic, time-varying and complex topics to model. When modeling regular competitions, such as domestic leagues, it


SAS SVP Kimberly May provides an update about the new SAS Customer Service Portal.


October 13 is National M&M Day in the US. It’s a time to reignite the debate about whether you can taste the difference between the different colored chocolate-filled candies. If you’re like me, equally as enjoyable as eating M&Ms is taking a crack at how many of them are in


Jak firmy tracą pieniądze? Oczywiście w różny sposób. Dzisiaj przyjrzymy się stratom w procesach zakupowych. Na początek dwa przykłady. W firmie zatrudniającej 75 tysięcy pracowników i współpracującej z około 120 tysiącami dostawców zbadano 480 tysięcy zamówień i ponad 800 tysięcy faktur. Przyjrzano się również pracownikom oraz związkom pomiędzy pracownikami i


Mój kolejny artykuł chcę poświęcić roli analityki w całym procesie oceny ryzyka kredytowego klienta firmy telekomunikacyjnej – od momentu złożenia aplikacji aż do windykacji. Postaram się przedstawić, jakie wsparcie zapewnia analityka w każdym z etapów tego procesu, czego można od niej oczekiwać, aby zmaksymalizować efekty biznesowe. Schemat prezentujący poszczególne etapy


As the holiday season approaches, businesses may be bracing for what’s been all too common in recent years – supply chain disruption. Retail and consumer goods industries have been hit with disruptions from every direction: profound shifts in consumer preferences, materials shortages, weather events, and geopolitical activities, to name just


Panel data are commonly used in today’s economics research. Panel data regression stands out as a powerful tool that aids in unraveling trends and patterns that evolve over time. This tool is particularly valuable when considering hidden factors in the investigations of cause-and-effect relationships. In this post, you will be