All Posts
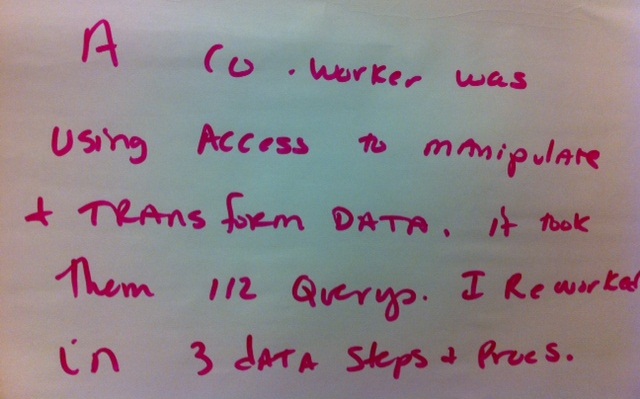

I think this DATA step Post-It author may be a bit like my mother. When I was a child, my mother was always coaching me on two things: being independent and being efficient. I believe those are the two traits she considered most admirable in a person. It's little wonder

Creating a graph that looks nice, with readable, high resolution fonts is important and should be easy to do. With SG procedures and GTL, this is easy to do with a simple option, but not the default. Creating a high resolution (image) for a graph consumes higher system resources. When working on a graph,

How to write a SAS macro program to repeat your SAS processing for each value of a BY grouping variable.
Art Carpenter’s newest book, Carpenter’s Guide to Innovative SAS Techniques, offers advanced SAS programmers an all-in-one programming reference that includes advanced topics not easily found outside the depths of SAS documentation or more advanced training classes. No matter how you approach the use of SAS software, the techniques provided in
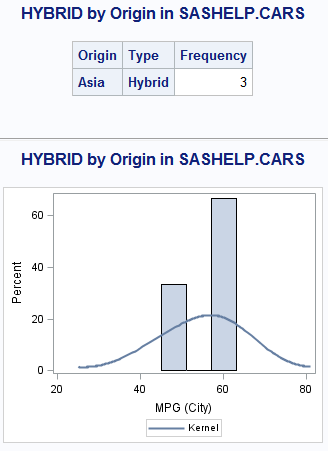
When the data is classified by multiple class variables, you can certainly create graphs using BY variables. This results in separate graphs, one for each level of the BY variable crossings. Each graph is scaled by its own data subset, and comparisons across BY levels is harder. When comparisons need to be
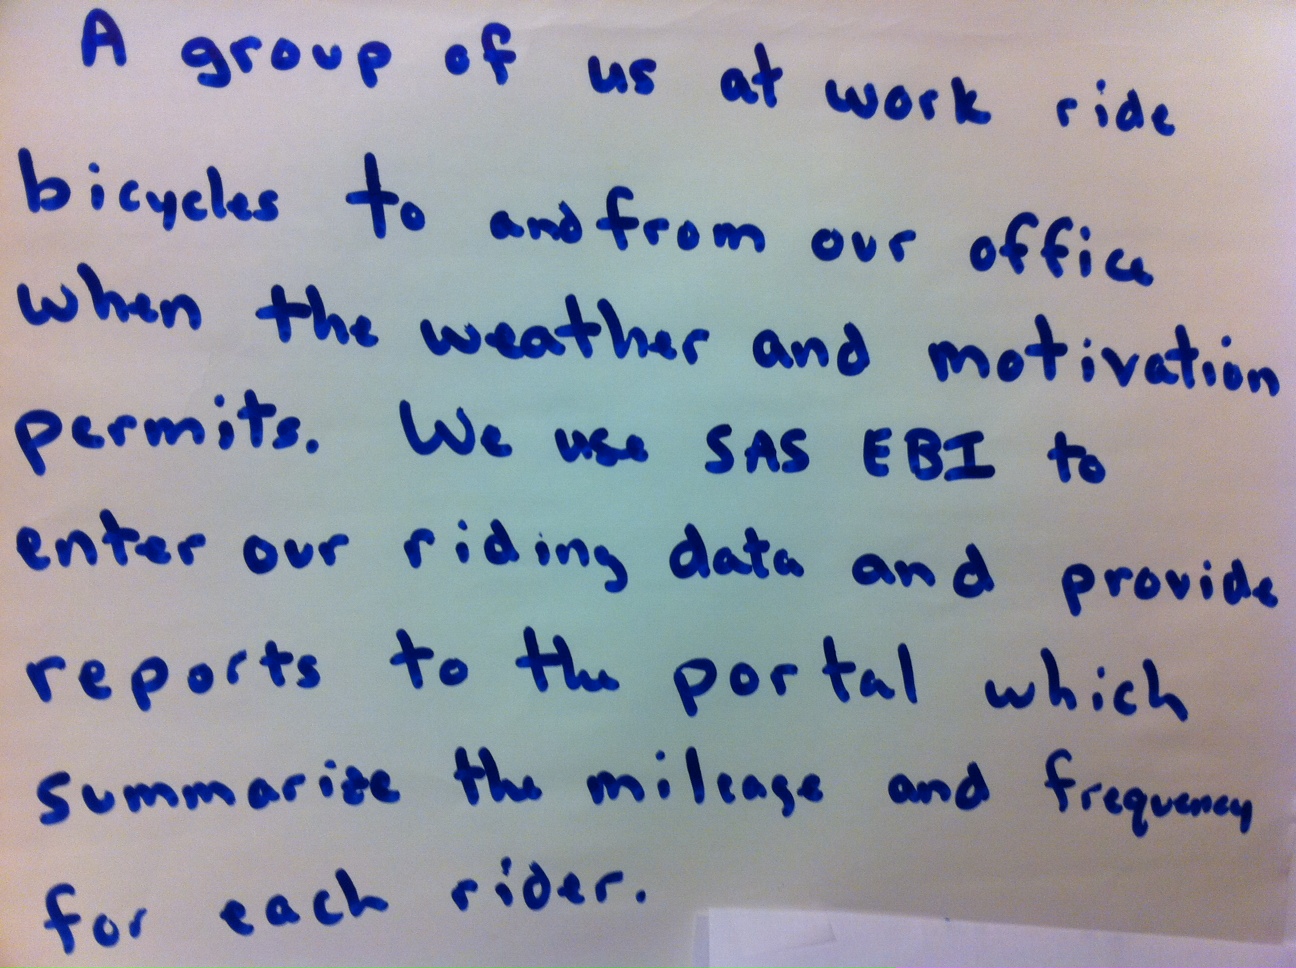
You can keep track of and report anything with SAS, even motivation - or the lack thereof. This team has developed a portal to analyze and report their ride data. It could just as easily be used for groups who want to work together to lose a few pounds, train


When you are constantly taking the data tables and completing joins to begin working on your reports or analysis it might be time to consider creating permanent views. Then you can just add the view to the Enterprise Guide project rather than dealing with the joins in a Query Builder


St. Patrick’s Day is almost here and for many it’s the perfect time to think green. This holiday, for me as a US citizen, means a little less than a month before taxes are due. I am often thinking green, as in money and saving some! For SAS users from around
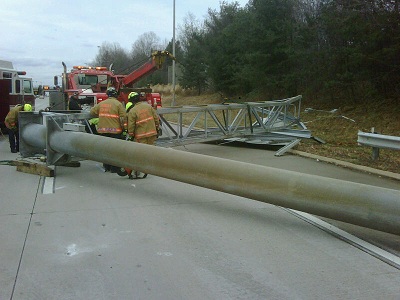

A few weeks ago, in Northern Virginia, a 30 foot highway sign fell onto I-66 and landed on a passing pickup truck. Fortunately, no one was hurt, but it drew media attention and caused motorists in the area to wonder about the safety of other signs and the transportation network
After unwittingly getting involved recently in a code vs GUI discussion another pro GUI vote came in yesterday when presenting to a customer's internal user group. When creating and using prompts in SAS Enterprise Guide, it is a no-brainer to recommend leveraging the %_eg_WhereParam as it handles all the special

Most users of the ODS Graphics system have probably had the need to adjust the dimensions of their graph output at times. The ODS GRAPHICS statement makes this easy to do. This statement supports the WIDTH= and HEIGHT= options. If you set just one of these, the system will calculate


Sometimes, I pick something fun to do with SAS/GRAPH so that I can learn and experiment with some of the more obscure functionality that I'm wanting to master. This is one of those situations. This fun graph allowed me to experiment with crosshatch patterns in maps, overlapping map areas and creating 'holes' in maps.

If your company has an EPTO account, it could be like getting a FASTPASS ticket to SAS Global Forum. EPTO units won't move you to the head of the line like FASTPASS (there are no lines), but they can pay for your SAS Global Forum event registration fees! Don’t know what
The Adverse Event Timeline graph posted earlier used the MARKERCHAR option of the SCATTER plot to draw the AE names. This option places a center-justified label at the marker position. There is no option in SAS 9.2 version to right-justify the label. Hence, we have to compute an offset in data
A few years ago I had the privilege of presenting the last technical paper at SAS Global Forum. This year, conference chair Andy Kuligowski asked me to go one better than that, and present a talk at the official Closing Session. What will I talk about? That's a mystery (maybe