All Posts


A good chunk of the SAS year revolves around SAS Global Forum. Pre-conference, everyone is busy polishing presentations and planning meetings. Post-conference is the best—attendees come back to Cary with heads full of customer ideas to implement and notebooks full of contacts to follow up on. One user's request found its


Humans have over 10,000 taste buds which are made up of hundreds of receptor cells that control our sense of taste. Each type of receptor responds to one of these 5 basic tastes: Sweet: activated by presence of sugars (ie: fruit, sugary drinks, desserts) Salty: activated by presence sodium chloride
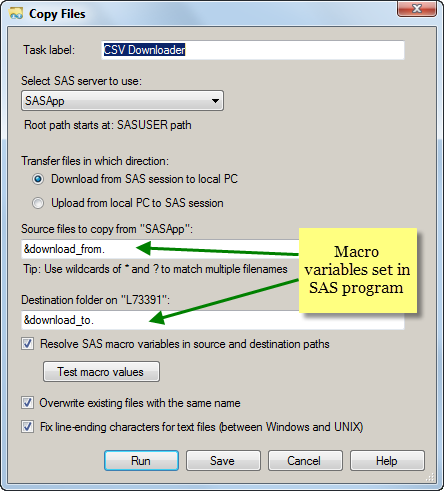

Last week I alluded to some very useful applications of the Copy Files task. This is one of them. If you have SAS Enterprise Guide 7.13 or later, the Copy Files task is in the Tasks->Data menu. In earlier versions, you'll have to download/install the task as a custom task.


Every time you see a rainbow, do you look to see where it begins and where it ends? Legend has it that there is a pot of gold at the end of each rainbow with leprechauns guarding it. While this might be popular Irish folklore, and you may not find
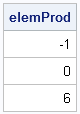

For programmers who are learning the SAS/IML language, it is sometimes confusing that there are two kinds of multiplication operators, whereas in the SAS DATA step there is only scalar multiplication. This article describes the multiplication operators in the SAS/IML language and how to use them to perform common tasks
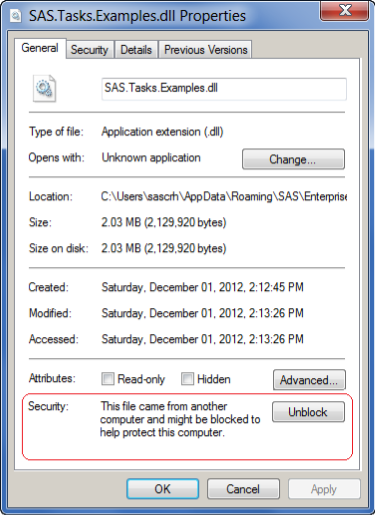
Recent versions of SAS Enterprise Guide (version 5.1 and later) use Microsoft .NET 4.0, which enforces additional security requirements before running custom task DLLs that you download from the Web, including those that you download from support.sas.com. Because these task DLLs are downloaded from the (big and scary) Internet, the
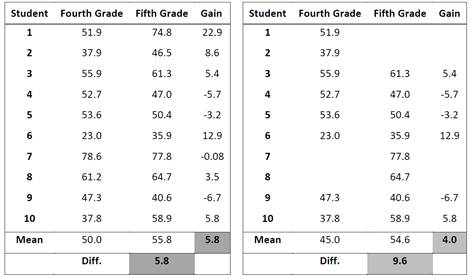

Students with missing test scores are often highly mobile students and are more likely to be low-achieving students. It is important to include these students in any growth/value-added model to avoid selection bias, which could provide misleading growth estimates to districts, schools and teachers that serve higher populations of these


SAS Global Forum 2013 is a couple weeks in the past, but the feedback and anticipation shared by customers as they heard about SAS 9.4 are still fresh in our minds here at SAS. As we put the final touches on the June release, the excitement we felt in San

The PharmaSUG 2013 conference in Chicago this week was awesome. From the perspective of graphics, there was great interest in using SG Procedures, Designer and GTL for building clinical graphs. It was nice to see many papers by users on how they are using these tools for creating graphs on a daily
A few months ago I released the Copy Files task for use with SAS Enterprise Guide. The task allows you to transfer any files between your PC and a SAS Workspace session, much like an FTP process. It doesn't rely on FTP though; it uses a combination of SAS code,
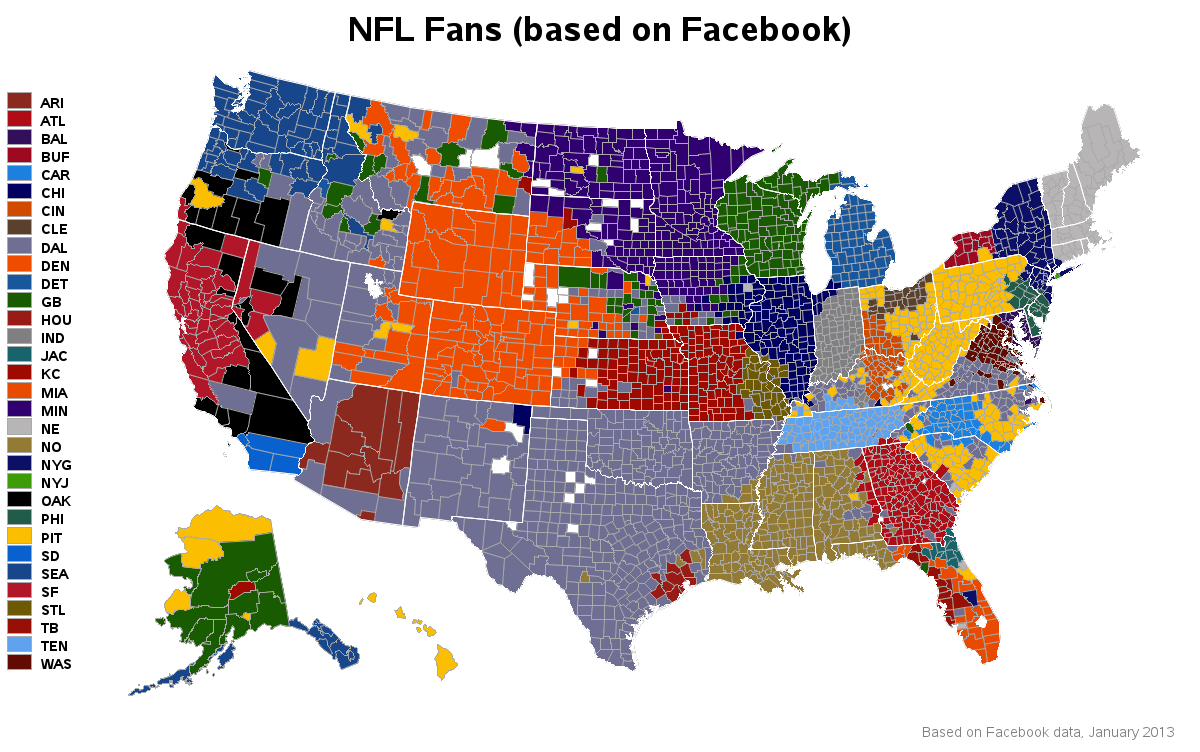

Are you an NFL fan, or curious about analyzing social media data? -- Well, in either case, this blog's for you! I recently read a fascinating Facebook article that included a U.S. county map showing which NFL (U.S. football) team had the most 'likes' in each county (based on ~35 million
We’re just coming back from SAS Global Forum, and what a show! SAS Books was there to provide users with the highest-quality resources for learning SAS, and our users were there to tell us what new books they were most looking forward to reading. Kevin Smith's PROC TEMPLATE Made Easy:
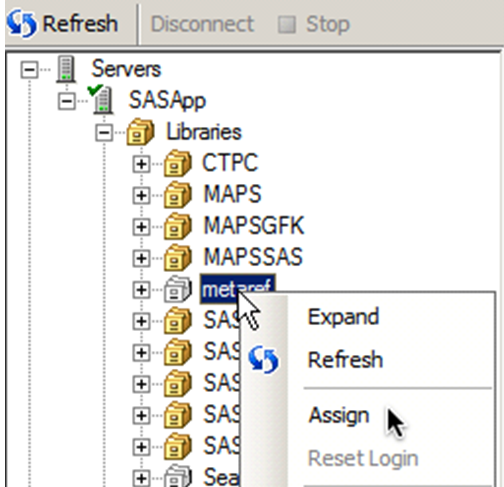

As we have seen my previous post "Seeing SAS data through metadata", there is a fundamental difference between accessing a SAS library using a physical reference or a metadata reference to that library. By now, you should now be an expert on the nuances of physical references to SAS data
Ever heard your grandmother say when you were little: If you have your heart set in the right place, you can achieve anything you set out to do! That’s what SAS users tried to do at SAS Global Forum 2013 held at Moscone West, San Francisco. The conference had a


Do you remember when CPU time was a high-priced commodity? "Today, if you are any good at what you do, the constrained resource is you," says Timothy Berryhill from Wells Fargo. Berryhill has years of experience with SAS on "many platforms and operating systems." He says there are several things