All Posts

I’m sitting here staring at a book on my shelf entitled, “Impending Crisis”. Even knowing the copyright date, 2003, it could still be about any one of several possible crises: healthcare, financial, energy, education, environment. But no, in this case the impending crisis in question is provided by the subtitle: “Too many jobs,


This fall, you’ll be swept off your feet in the Windy City: The 2014 Midwest SAS User’s Group (MWSUG) takes place in Chicago from October 5-7. With 135 presentations in 11 different sections, you’ll have the chance to expand your SAS know-how and network with fellow SAS professionals.


A SAS customer wrote, "I have access to PROC IML through SAS OnDemand for Academics. What is the best way for me to learn to program in the SAS/IML language? How do I get started with PROC IML?" That is an excellent question, and I'm happy to offer some suggestions.

A few weeks back I wrote an article on Grouped Timeline for creating a stacked timeline for onset of different virus. The idea in that article was to display a stacked needle on a time axis using a HighLow plot. Such graphs are also referred to as EPI or Epidemic Curve
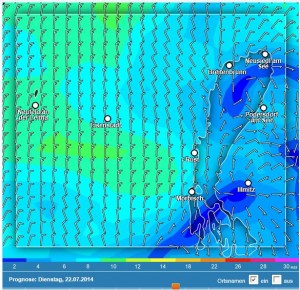

It is a mild summer evening in July at Lake Neusiedl here in Austria. The participants of the traditional YES Cup Regatta are sitting with beer and barbecue chops on the terrace of our clubhouse. The mood is relaxed, and everyone wants to tell their story after two eventful races.


On Facebook the other day a friend “liked” one of her friend’s posts, so it appeared in my news feed. I opened the link, read the article and started crying. You would have too. It was an article by a former social worker in Durham County, N.C. on what it was like


The Amazon River starts as a small glacial stream, pictured at right, on a mountain called Nevado Mismi in the Peruvian Andes. This, and many other small streams, lead to over 1,000 named tributaries of the largest drainage basin in the world -- and the greatest diversity of life on


What’s not so great about summer? The post workout shower sweat. You know what I’m talking about. You had a great workout: 3 minute warm up, 40 minutes of sweaty intervals, followed by a 2 minute “cool down” which involved you walking from the gym into the locker room. You
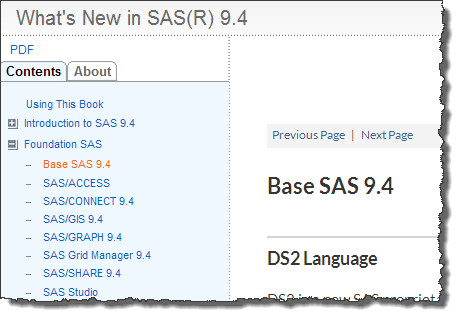

Today SAS began shipping the second maintenance release of SAS 9.4, colloquially known as "SAS 9.4M2". This is an incremental release, meant to build upon the already-solid SAS 9.4 platform. Even as a SAS insider, I cannot possibly keep track of every new feature that has been added in maintenance.


You may have heard the phase that big data is the new oil. Well (pun intended), if that is the case, then analytics should be thought of as the fracking technique used on data to improve the value you get from this new oil. Fracking is actually just one
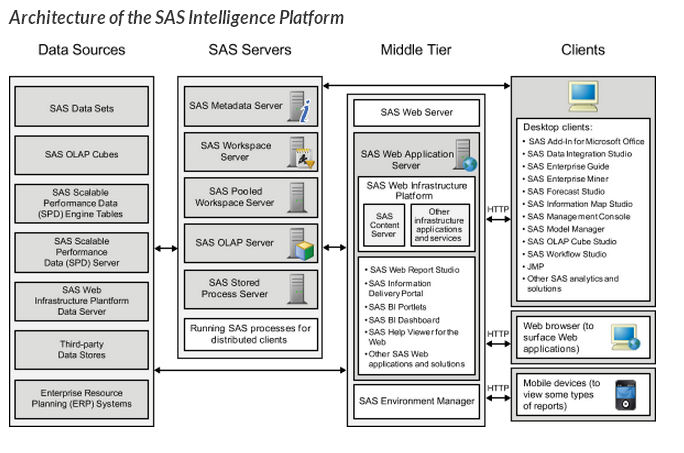

You are the new SAS Administrator. After the initial shock or excitement, you sit back and wonder, “What does that MEAN???” In an enterprise environment there are often divisions of duties. The SAS Intelligence Platform is no exception. Just take a look at the architecture. Just looking at this picture,
This article is by guest contributor Lelia McConnell, SAS Tech Support. Several users have called recently to ask the question, “Can I reorder the legend entries on the bar chart that I created with PROC SPLOT?” Although there is no option that does this directly in PROC SGPLOT, the answer


For those of you who are classic rock fans, you may remember Alice Cooper’s title track “School’s Out for Summer” on the album “School’s Out.” That song captures students’ excitement of a taking a hiatus from the classroom. But for professors, summer is a time to continue their own education
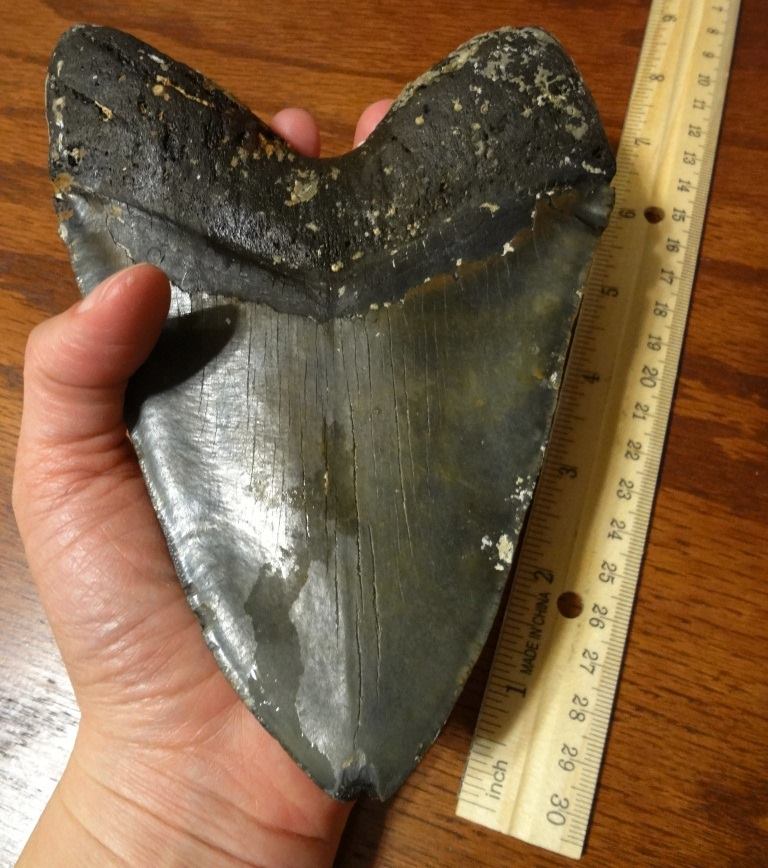

With Discovery Channel's Shark Week starting on August 10, I decided to sink my teeth into some shark-attack data - I even found there were some shark attacks in the Midwestern US! Read on to learn the details... To get you into the shark mindset, here is a photo of an


What insights can be gained from the massive amounts of data that allow us to make decisions that deliver the best results? Data vs. information is an ongoing battle. Many people look for more data to make confident decisions. However, what most people seek is insight. Retailers always have tracked