All Posts


The rise of analytics and big data presents a once-in-a-generation opportunity for organisations to put themselves at the cutting edge, to create a competitive advantage by developing a culture of analytical success within their organisation. Yet most seem unable to grasp the opportunity that is within their reach. Eric Hoffer


After attending the SAS Day at Texas A&M University on Oct. 2, I came away with a new perspective on some of the different educational offerings to help fill the analytic talent gap (which according to studies and research continues to grow). In essence, there is a yin and yang of


The only thing that’s constant is change. The continual cycle of computing changes leads to common questions about the effects of these changes—operating systems are getting upgraded, customers are moving to new SAS clients, upgrading to new releases of SAS, working with new Java and browser versions. All of these


What age women do men prefer on dating websites? - Let's have a look at the data... When I first started using computers in the early 80s, I thought it would be great to have everyone take a survey, and then let computers show you who your best matches were.


Today’s self-parking cars are a marvel, but that’s nothing compared to what’s just around the corner: Autonomous vehicles that can taxi you efficiently around a city, onboard navigation systems that warn of bad drivers or traffic jams nearby and offer safer, quicker alternative routes; trucks that haul commerce safely and


In previous posts, we’ve shared the importance of understanding the fundamentals of Kerberos authentication and how we can simplify processes by placing SAS and Hadoop in the same realm. For SAS applications to interact with a secure Hadoop environment, we must address the third key practice: Ensure Kerberos prerequisites are met

On Wednesday, October 15, Ed and I will be spending the morning at the North Carolina Museum of Natural Sciences. It’s a great museum, and I always love going there, but that day holds an especially cool event. It’s called the STEM Career Showcase for Students with Disabilities. (If you


You might assume that a battle-tested businessman with a gruff exterior and a taste for salty language lacks an inner child, but you’d be wrong. Exhibit A is this little-known fact: I have a soft spot for animated Disney movies. Now, I could try to bluff a bit and say


I wrote “Business Transformation” to guide leaders through a journey to transform their organizations. I included methodologies and examples gathered throughout my 29-year consulting career to assist them. Every executive and leader focuses on how to use resources to produce value. Of course, value can be defined in many terms


When SAS is used for analysis on large volumes of data (in the gigabytes), SAS reads and writes the data using large block sequential IO. To gain the optimal performance from the hardware when doing these IOs, we strongly suggest that you review the information below to ensure that the
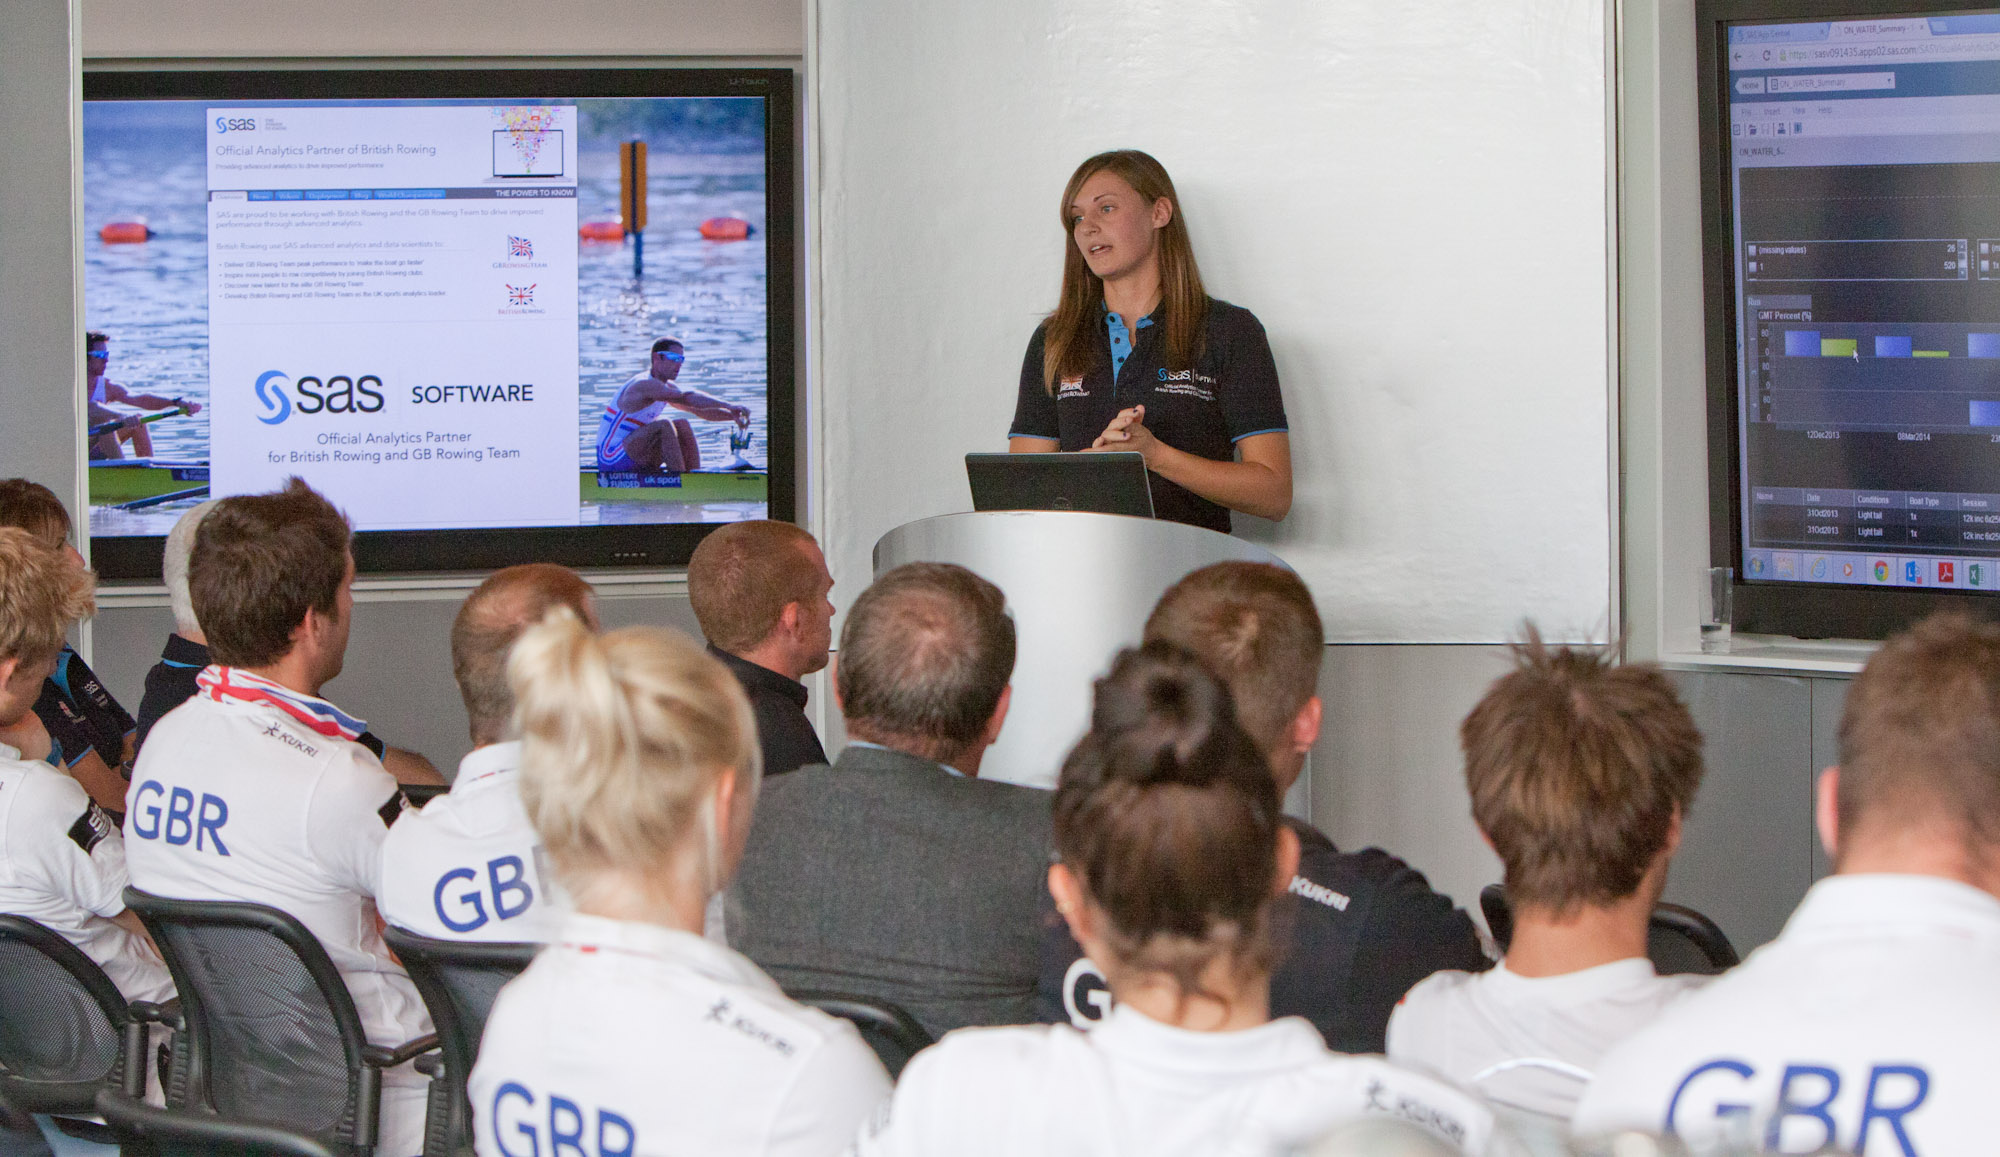

Since my opening blog post about our new partnership with British Rowing and the GB Rowing Team, I’ve had a deep dive into their data, and we’re now close to our first key milestone – having all the data about a rower in a single location, so we can then


Artificial sweeteners have been a controversial topic since they came into the market decades ago. There has been an ongoing debate over the potential health benefits and risks of artificial sweeteners, which are among the most common food additives and are consumed by hundreds of millions of people around the

SAS/IML 13.1 includes a handy function for programmers who write a lot of modules. The PARENTNAME function obtains the name of the symbol that was passed in as a parameter to a user-defined module. How is this useful? Well, suppose that you want to create a SAS/IML module that prints
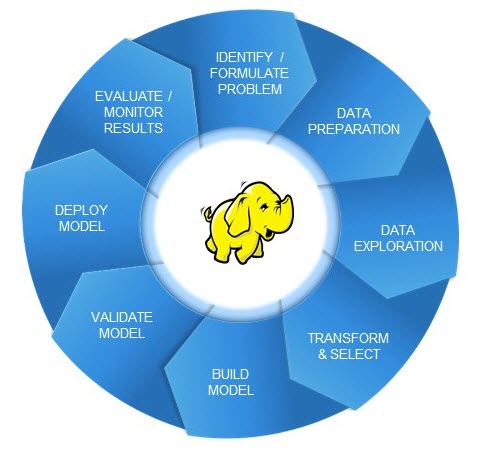
SAS has been developing "secret sauce" technology for more than 38 years. Whether it has to do with being platform independent, processing in-database, running across a grid, or analyzing data in-memory like our SAS LASR Analytic Server or our High Performance Analytics offerings, secret sauce makes everything taste or, in


At most banks, data is stored in separate databases and data warehouses. Customer data is stored in marketing databases, fraud analyses are done on transactional data, and risk data is stored in risk data warehouses. Oftentimes even liquidity, credit, market, and operational risk data is stored separately as well. Bringing