All Posts

This is the first of two articles looking at how to listen to what your customers are saying and act upon it – that is, how to understand the voice of the customer. Over the last few years, one of the big uses for SAS® Text Analytics has been to
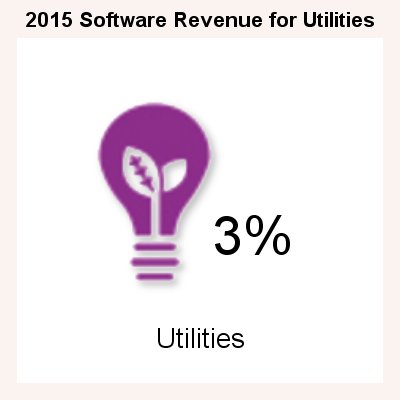

Infographics are all the rage today. Open any magazine or newspaper and we see data and numbers everywhere. Often, such information is displayed by adding some graphical information to add context to the data. A couple of good examples are Communicating numeric information, and Facts about Hot Dogs. Riley Benson, our UX


In my previous post, I discussed the characteristics of a strong data strategy, the first of which was that a formal, well-defined strategy exists within your organization. This post discusses how often (and why) your organization’s data strategy needs to be updated. While strategy encompasses and sets the overall direction for


You know when you visit Las Vegas you’ll have an experience you can only find in this one of a kind city. Where else can you gamble around the clock, get married in a drive-through, or see the Eiffel Tower without visiting Paris? So in the spirit of Vegas, SAS
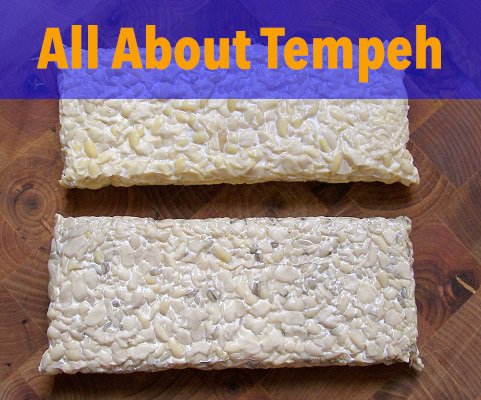

A few years back I did a blog about my love for tofu, so I feel I am way past due for a blog on tempeh. Tempeh is like tofu’s hippy cousin- more fiber, and fermented. Tempeh doesn’t seem to get the same recognition that tofu does, which seems odd
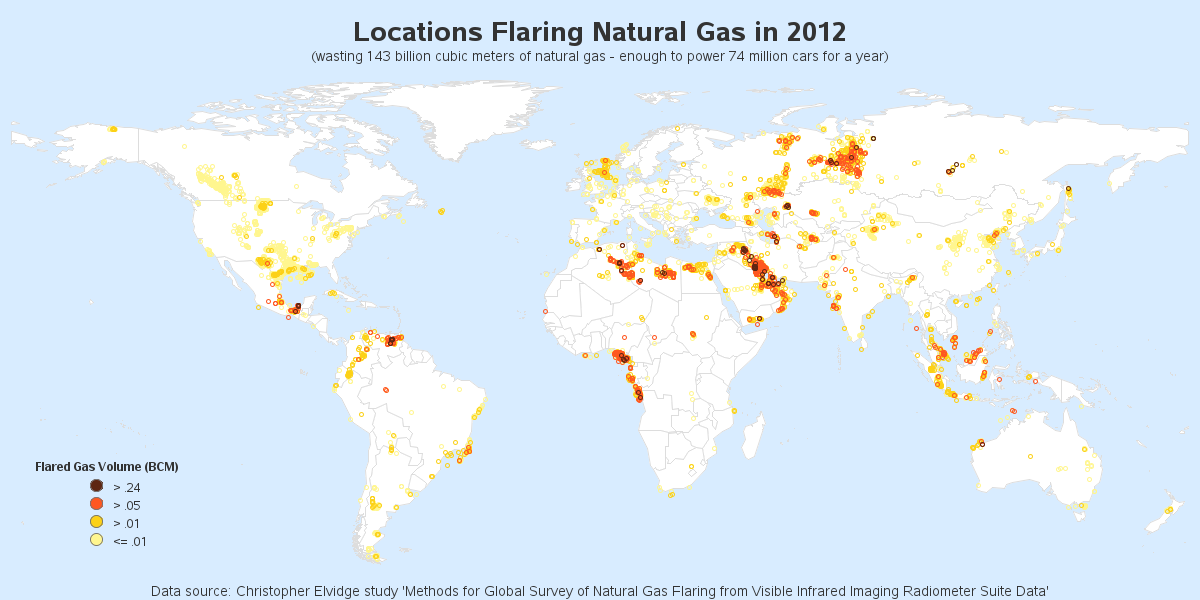

Did you know you could drive 74 million cars using the wasted natural gas that is flared from oil wells and refineries? Learn more details in this blog post! Flaring (burning) is commonly used to dispose of natural gas produced at oil and gas facilities that lack the infrastructure to capture it


In my two prior posts, I discussed the process of developing a business justification for a data strategy and for assessing an organization's level of maturity with key data management processes and operational procedures. The business justification phase can be used to speculate about the future state of data management required


As another year goes by, many people think about new year’s resolutions. It’s probably the third year in row that I’ve promised myself I’d start exercising in the fabulous SAS gym. Of course, I blame the recently concluded holiday season. With all the food-focused events, I couldn’t resist, ate way


Like most boys my age at that time, I wanted to be an astronaut. Fate, however, intervened, in the form of nearsightedness, so I had to find an alternative occupation. Coming to my rescue for the launch of Apollo 11 was my father, who presented me with a huge booklet that broke


En México se desarrolla el proyecto Sistema de Protección Social 2014-2018, en donde el Banco Mundial otorgó un préstamo a la Sedesol para aumentar el acceso de los beneficiarios de Prospera a programas sociales y productivos, así como para desarrollar instrumentos para un Sistema Integrado de Protección Social de largo


Featuring a computer-savvy kid and Cold War intrigue, the 1980s movie War Games inspired more than one generation of STEM graduates. Sean Dyer is one Gen X’er who credits the movie for sending him on a path to where he is today as a cybersecurity data scientist. As the fog


Data virtualization simplifies increasingly complex data architectures Every few months, another vendor claims one environment will replace all others. We know better. What usually happens is an elongated state of coexistence between traditional technology and the newer, sometimes disruptive one. Eventually, one technology sinks into obsolescence, but it usually takes much longer than we expect. Think of
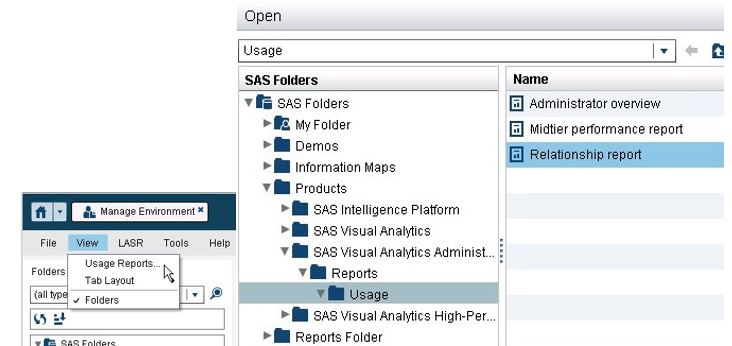

In SAS Visual Analytics 7.3, the usage reports accessed from the administrator includes a relationship report. This report provides very basic lineage and dependency information for selected object types. The data to populate this report comes from the middle-tier relationship service. Once you enable the collection and extraction of this


¿Cómo puedo conocer mejor a mis clientes? ¿Qué debo decirles para tenerlos satisfechos y leales? ¿Cómo optimizo mi presupuesto para mantener a mis clientes y a la dirección satisfechos? Si usted es un tomador de decisiones en una empresa, está relacionado con la parte comercial o es el responsable de

In the SAS/IML language, you can read data from a SAS data set into a set of vectors (each with their own name) or into a single matrix. Beginning programmers might wonder about the advantages of each approach. When should you read data into vectors? When should you read data