All Posts

A few weeks back I posted an article on ways to create a WindRose Graph using SGPLOT procedure. The process is relatively simple. Create (R, Theta) data with both numeric axes where the Theta is a value in the data range is 0-360, and R is the corresponding response value. Then


A long time ago, I worked for a company that had positioned itself as basically a third-party “data trust” to perform collaborative analytics. The business proposition was to engage different types of organizations whose customer bases overlapped, ingest their data sets, and perform a number of analyses using the accumulated


What would come to mind if you were told that you have to attend a SAS training course? Perhaps, you have a vision of an instructor sitting at the front of a classroom, endlessly reading PowerPoint slides verbatim in a monotonous voice while you sit there baffled, wondering what is
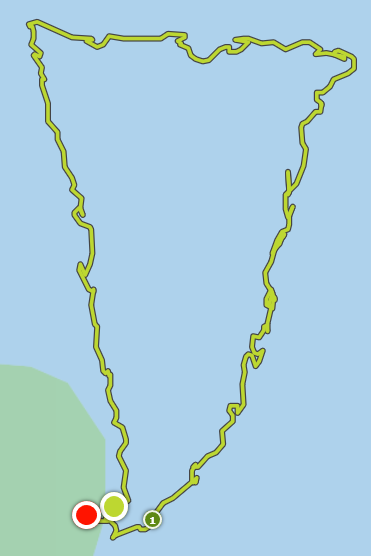

I’m an avid open water swimmer. In order to succeed in open water races I must do two things: I must sight properly in order to swim the straightest line possible in the right direction. The straighter the line, the less I have to swim. I must use a powerful,
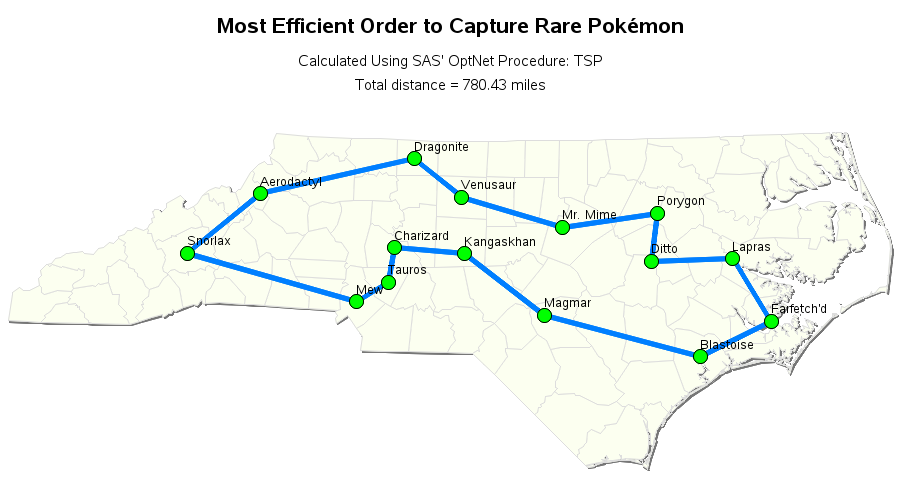

Were you the kid who sat there analyzing the amusement park map before entering the park, planning out how you could visit the most rides in the least amount of time? If so, then this blog's for you, my data analyst kindred spirit! And to get you in the mood,
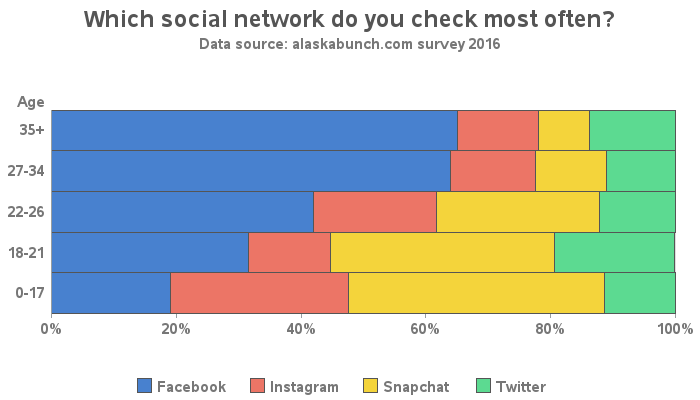
The way your graph looks can make all the difference ... two people can graph the exact same data in essentially the same way, but one of the two graphs can be perceived as much better than the other. Hopefully reading my blogs will help you create the better graph!


Why they will still play a valuable role in organizational data-management and -integration efforts.


First it was the patriarch of my favorite family. That shocking Red Wedding scene meant I could cross off several more characters I’d grown to love. When the season finale of Season 5 left me asking if we’d lost yet another one of my favorites, I wasn’t sure how much

Today, I was in a conversation about using Hadoop (a big data platform) for master data management (MDM). I still find it amazing when we have the discussion of what systems feed another system. Many of our friends have spent years creating MDM for customer, product, etc. with success. I'm a


¿Es posible optimizar el uso de los recursos públicos? Una pregunta interesante para aquellos líderes de Gobierno que están orientados a resultados y preocupados por alcanzar el máximo potencial de su gestión, sobre todo al momento de rendir cuentas de manera clara y oportuna a la ciudadanía. La buena


In the spirit of our “40 and forward” theme to celebrate 40 years of SAS, this blog focuses on David Dickey, an accomplished SAS user since 1974 and a SAS instructor since 1981. He actually co-wrote the original Time Series SAS course in 1981, and helped with the most recent


Following a vegan diet? Allergic to eggs? Or in the middle of baking your favorite recipe only to realize you’re out of eggs? Fortunately, there are numerous egg substitutes you can use that you likely have in your pantry or fridge.
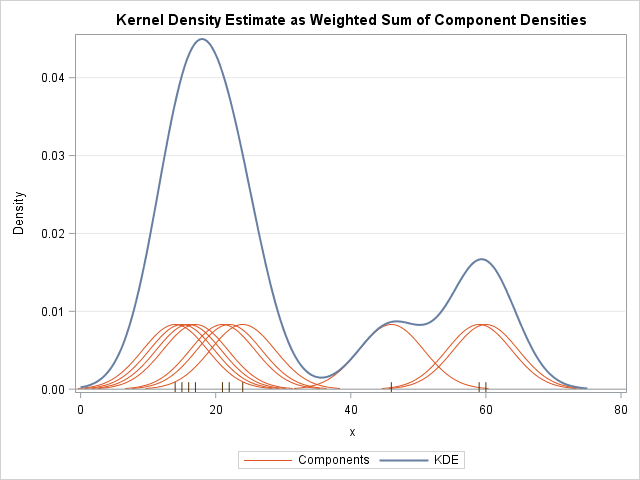

A kernel density estimate (KDE) is a nonparametric estimate for the density of a data sample. A KDE can help an analyst determine how to model the data: Does the KDE look like a normal curve? Like a mixture of normals? Is there evidence of outliers in the data? In


El concepto de Big Data ha revolucionado la forma de entender el manejo de la información de forma global y estratégica, comprendido hoy en día en dos variantes: el volumen en el manejo de la información, y su velocidad de generación. Para entenderlo y conceptualizarlo, hay que tomar en cuenta


You've seen the terms #squadgoals or #lifegoals - to me, one #worklifebalancegoal is to be able to have time to volunteer outside of work. I could go on about the importance of service and how we are all connected but will have to save that soapbox for a different blog/time. From a happiness