All Posts

.@philsimon asks some fundamental questions about taking the next step with #bigdata.


Research indicates that IoT and Machine Learning are more valuable to utilities when used in combination but there are hurdles to overcome first. Machine learning and IoT will enable utilities to better realize the next generation of the power grid: a distributed system with power flows among millions of things


I admit, I’ve always loved beets! I can remember eating beets right out of the can as a kid. My grandma would also pickle them. YUM! I love beets! I actually never had a fresh beet until I got a little older and was cooking for myself. The difference between
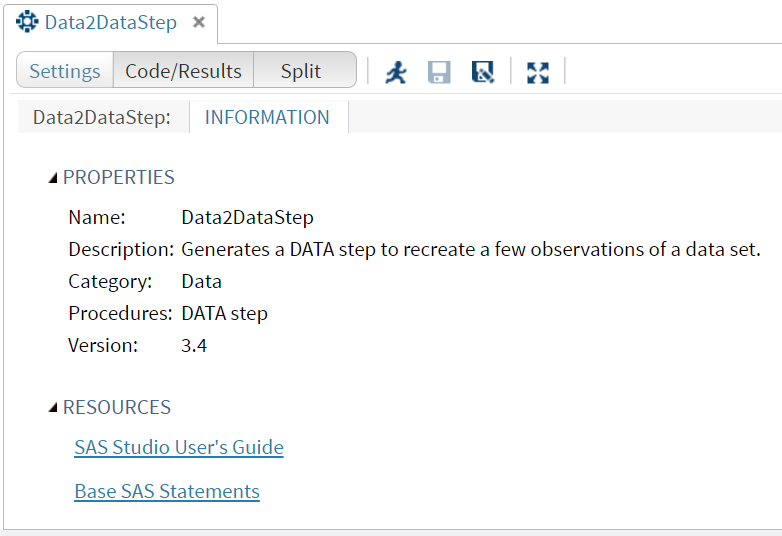

In my previous post, Jedi SAS Tricks - Make This a Button in Base SAS I demonstrated running a SAS program from a tool bar button in the SAS Windowing environment. The program we execute is the macro from a previous post, Jedi SAS Tricks: The DATA to DATA Step
El año pasado, un alud en el norte dejó miles de damnificados. Según datos del Gobierno de Chile, los daños materiales ascendieron a los 1200 millones de dólares. Sin embargo, una de las principales preocupaciones de las autoridades pasó por recuperar física y sicológicamente a las personas que sufrieron el


As everyone in the financial industry knows, CCAR (comprehensive capital analysis and review) was set up as a capital adequacy assessment for the major US banks. Through several years of practice and feedback, CCAR has evolved into a comprehensive stress testing exercise -- and in doing so, created a new


Hoy en día es de vital importancia voltear a ver, escuchar y entender a los usuarios, debido a que un solo producto o servicio por sí solo no representa algún valor cuando se tiene un gran número de competidores con el mismo producto, es necesario darle un valor agregado y


How do you define Health? What about Fitness or Wellness? To me there is a lot of overlap. For example, if I say I ran 3 miles today, would you say the run benefited my health, improved my state of fitness, or contributed to my overall well-being? I believe I


In my previous post I discussed the practice of putting data quality processes as close to data sources as possible. Historically this meant data quality happened during data integration in preparation for loading quality data into an enterprise data warehouse (EDW) or a master data management (MDM) hub. Nowadays, however, there’s a lot of


The current rate of workforce change is unprecedented. Each new generation of working professionals is emerging more rapidly than the one before, with increasingly advanced expectations of their employers. The latest cohort is Generation Z, typically defined as those born after 1998. This group is fresh-faced, independent and extremely pragmatic.


Not everything that happens in Vegas stays in Vegas. At this year’s SAS Global Forum 2016, so many exciting things happened that I have to share some highlights. From the use of analytics in college administration to the teaching of analytics in the classroom, the range of information presented was quite


Strengthen your core, lengthen your spine and create hamstring flexibility! Standing Big Toe (Sanskrit: Utthita Hasta Padangusthasana)
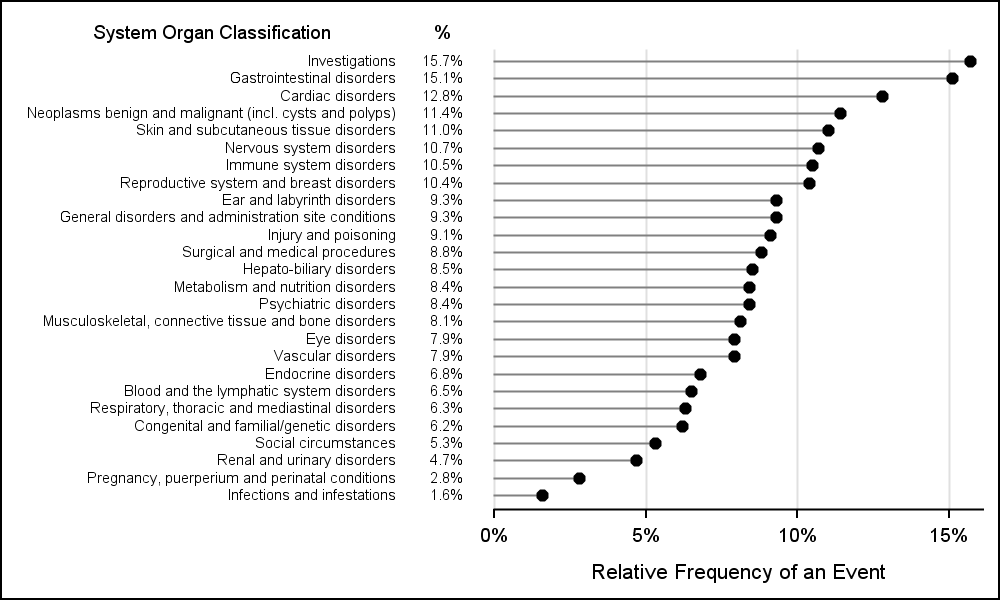

CTSPedia is a valuable resource for clinical research "... initiated to form an information resource created by researchers for researchers in clinical and translational science to share valuable knowledge amongst local researchers". This site includes a section on statistical graphs where you can find valuable information and a library of standardized


We had just completed a four-week data quality assessment of an inside plant installation. It wasn't looking good. There were huge gaps in the data, particularly when we cross-referenced systems together. In theory, each system was meant to hold identical information of the plant equipment. But when we consolidated the


En el mundo en el que vivimos, caracterizado en la rapidez de la información, nos hemos empezado a acostumbrar a términos como Big Data o el Internet de las Cosas. Lo primero nos hace pensar en muchas cifras y datos. Lo segundo, en la interconectividad de todo y los muchos datos que eso