All Posts

Whether your resolution is to get SAS certified or to become a more advanced SAS programmer, we’ve got you covered with these new titles and upcoming SAS Press books, many of which will be making their bookshelf debut at SAS® Global Forum 2017 in Orlando, FL! Want to be notified when a new book


Si se desea comprender cómo se desarrollan los procesos de Data Management y con ello poder hacer uso de todos los beneficios que éstos ofrecen, como primera instancia debemos clarificar qué es el Data Management y cómo está integrado. De acuerdo a la DAMA, Data Management Association, este concepto engloba


Strengthens arms, core and quadriceps; opens shoulders and chest while lengthening hamstrings (great pose for the entire body) Downward Facing Dog Pose (Sanskrit: Adho Mukha Svanasana) Come onto floor on hands and knees. Place knees directly below hips and hands slightly forward of shoulders. Spread palms, middle fingers parallel


Regardless of how long they’ve used the software, there’s no better event for SAS professionals than SAS Global Forum. The conference will attract thousands of users from across the globe and is an excellent place to network with and learn from users of all skill levels. To help those relatively
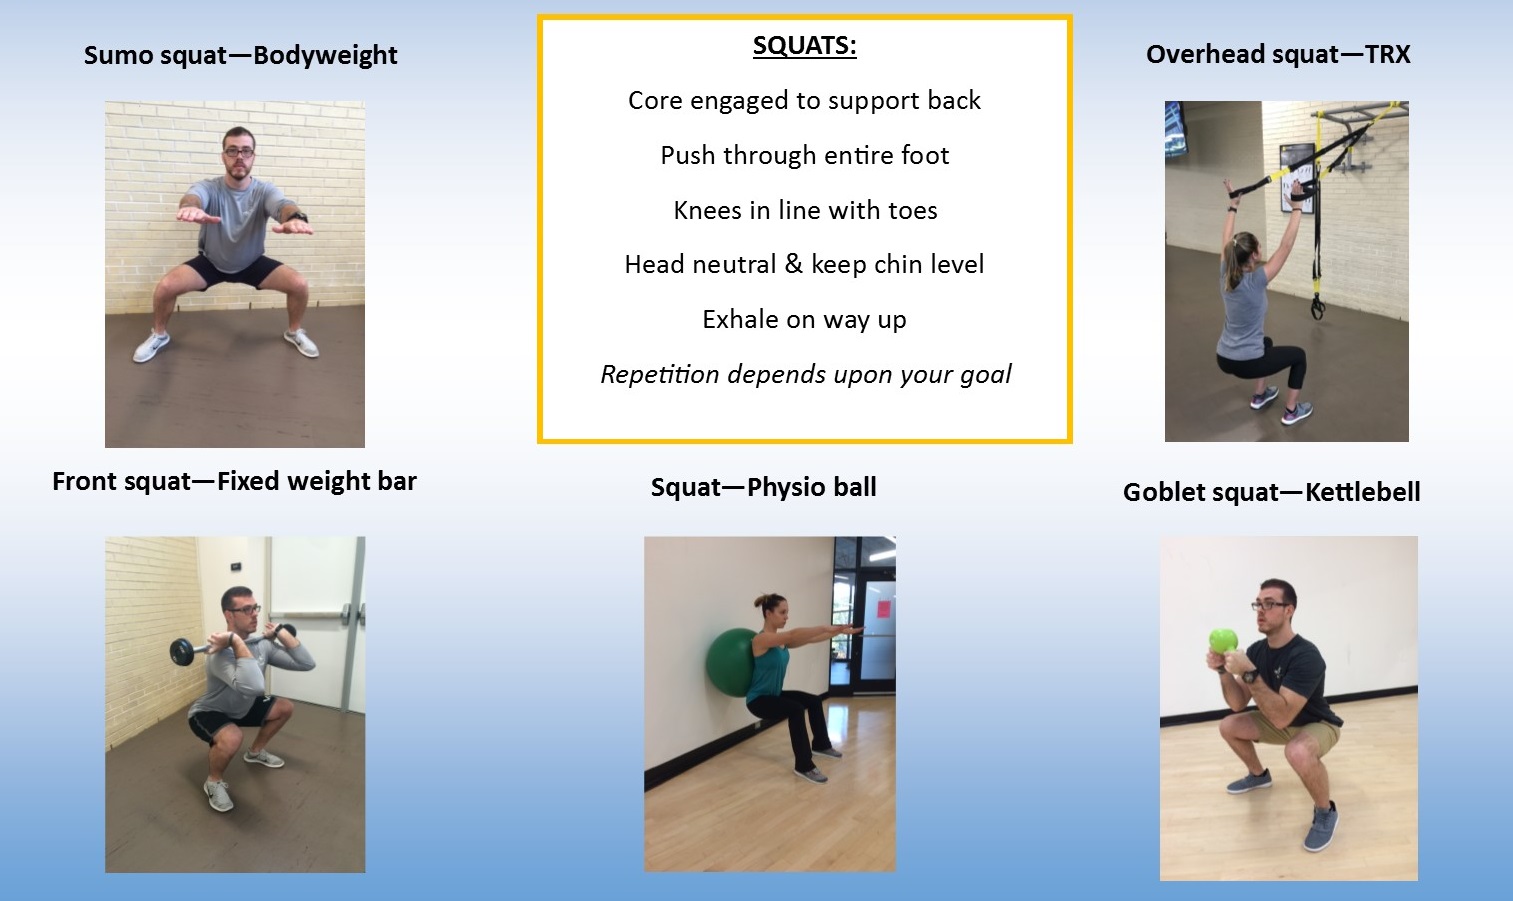

Happy New Year! We're switching things up this year, instead of a workout of the month, we're featuring a move of the month. We'll provide options that require equipment while others can be done anywhere. Refine your technique and try a new variation! Up first - SQUATS
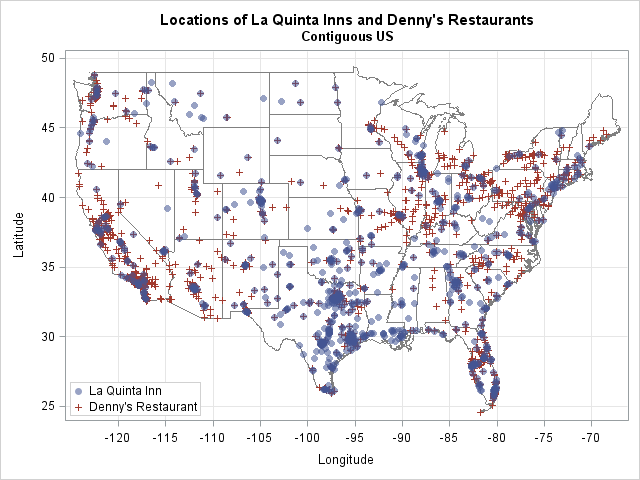

“La Quinta” is Spanish for “next to Denny’s.” -- Mitch Hedberg, comedian Mitch Hedberg's joke resonates with travelers who drive on the US interstate system because many highway exits feature both a La Quinta Inn™ and a Denny's® restaurant within a short distance of each other. But does a
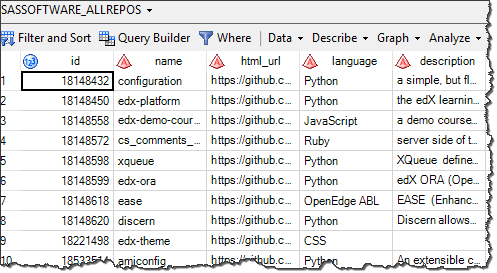

At SAS, we've published more repositories on GitHub as a way to share our open source projects and examples. These "repos" (that's Git lingo) are created and maintained by experts in R&D, professional services (consulting), and SAS training. Some recent examples include: sas_kernel, which provides Jupyter notebook support for SAS.


Much of my recent work has been along the theme of modernization. Analytics is not new for many of our customers, but standing still in this market is akin to falling behind. In order to continue to innovative and remain competitive, organizations need to be prepared to embrace new technologies


A lo largo de cuatro décadas de liderazgo en temas de Analítica Empresarial, SAS mantiene su compromiso con las organizaciones al ir de la mano afrontando los retos que el mercado y su negocio demandan, por ello ofrecemos capacitaciones, certificaciones y training online o presenciales, para cubrir las necesidades y


What are the most useful skills a data quality leader can possess? As an editor of an online data quality magazine, I naturally get asked this type of question regularly at events and meetups. My answer may surprise some who are expecting a data-centric response. I firmly believe that sales and
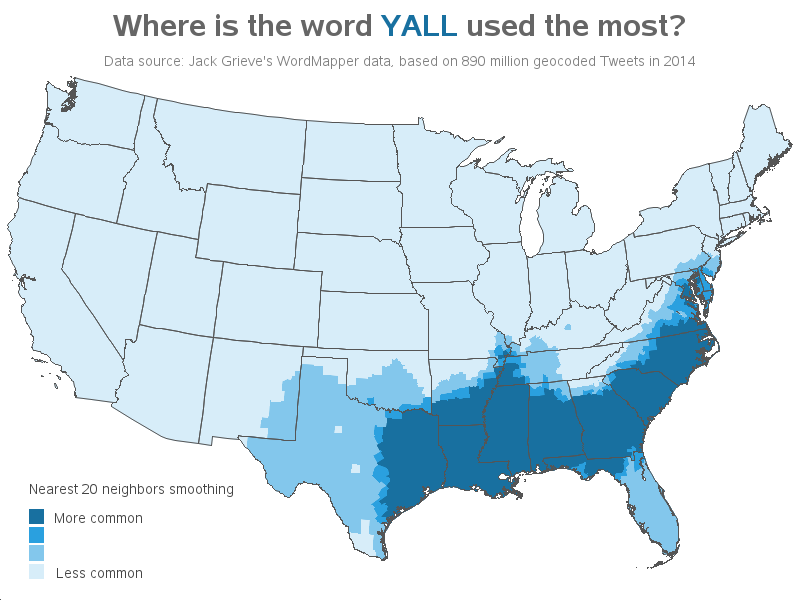

If you do much traveling in the United States, you're bound to hear a few words and expressions that are unique to certain areas. Well y'all get ready, because I'm fixin' to analyze some of those words for ya! I recently found a really neat web application called The Great
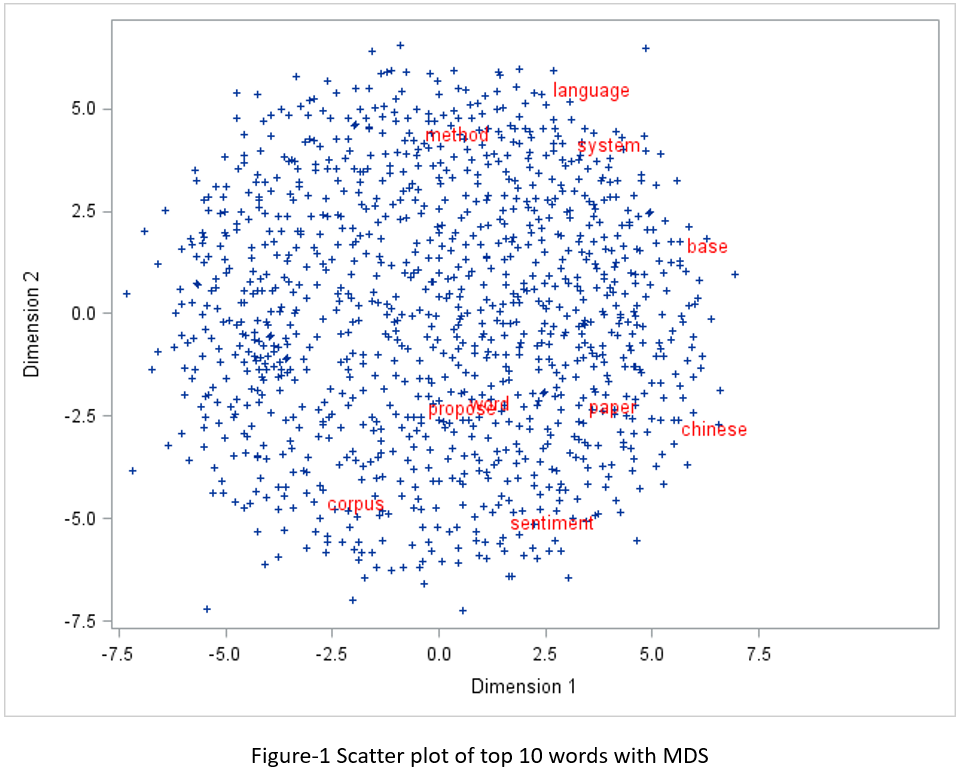

In my last post, I showed you how to generate a word cloud of pdf collections. Word clouds show you which terms are mentioned by your documents and the frequency with which they occur in the documents. However, word clouds cannot lay out words from a semantic or linguistic perspective.

As the New Year has woven its way into our landscape, I think of the days that have vanished into the horizon. I’m reminded of how quickly the seasons pass and how synonymous they are with resolutions. We begin by planting seeds in the cool, moist soil. We tend our
I wrote 105 posts for The DO Loop blog in 2016. My most popular articles were about data analysis, SAS programming tips, and elementary statistics. Without further ado, here are the most popular articles from 2016. Data Analysis and Visualization Start with a juicy set of data and an interesting


¿Cómo alcanzar el éxito empresarial basándose en la analítica y gestión información? Esta es una pregunta que resulta común en las compañías cuando se está considerando la adquisición de algún servicio de Business Intelligence, y la pregunta puede responderse planteando una nueva interrogante ¿cómo podría usted o su equipo tomar acertadas