All Posts


David Loshin describes three sets of policies required for ensuring compliance with data protection directives for health care.


¿Se ha preguntado de qué manera la inteligencia artificial puede realzar la interacción con sus clientes? Es probable que lo haya hecho de varias maneras y utilizando conceptos similares, con respuestas muy variadas. Por ahora, comencemos por el principio, ¿qué es la inteligencia digital y cómo puede ayudar a su


A common request we receive about SAS Global Certification practice exams is to make them as close as possible to the actual exams so that future test takers get a more accurate feel for the overall exam experience. Good news. Our new practice exams come as close to the “real thing”


Editor's note (4/11/17): Full proceedings from SAS Global Forum 2017 (including for the presentations mentioned in this blog) can be found at http://support.sas.com/resources/papers/proceedings17/. SAS Global Forum 2017 is just a month away and, if you’re a SAS administrator, it’s a great place to meet your peers, share your experiences and attend


In 2011, Loughran and McDonald applied a general sentiment word list to accounting and finance topics, and this led to a high rate of misclassification. They found that about three-fourths of the negative words in the Harvard IV TagNeg dictionary of negative words are typically not negative in a financial


.@philsimon raises some chilling questions about the IoT and current threats.


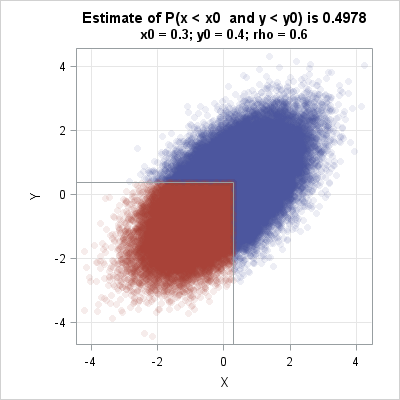

Monte Carlo techniques have many applications, but a primary application is to approximate the probability that some event occurs. The idea is to simulate data from the population and count the proportion of times that the event occurs in the simulated data. For continuous univariate distributions, the probability of an


DevOps is enjoying a lot of attention at the moment, mostly because of its promise to increase software quality at lower cost. DevOps is a hybrid term linking development and operations. It's a philosophy that focuses on improving efficiencies in how we build and deliver software, solutions and the supporting environments.


As a single mom of 10 years, I have vacillated back and forth from “There is no evening that I wouldn’t rather take a bath than go on a date” to “ok, this might be fun.” Mostly, thinking about dating as a single parent just makes me tired. Whether you


Los episodios económicos y financieros del presente siglo han apremiado al sistema financiero a generar bases exhaustivas, perdurables y también adaptables tanto en el ámbito local como el internacional; sin embargo, aún se siguen analizando, probando, modificando e implementando planes, estrategias e ideas sobre el camino, lo cual no es


At its core, data compliance is built on simple foundations. Dylan Jones closes this series by explaining the remaining components of the "4F framework."


Does your data just look like a bunch of dots? Would you like to bring those dots to life so they can tell their story? This example shows how to make some voter-registration dots a bit more lifelike, so you can see what they're saying. You can apply the same


Do you remember the 90s? It seemed like every company and organization had some sort of strategic plan that had “2000” in its title. And they were all going to achieve and exceed these Year 2000 goals … if their systems didn’t crash at 12:00:01 on January 1, 2000! So


To show how they're compliant with regulatory mandates, organizations first need an enterprise data strategy. Joyce Norris-Montanari discusses the issues.