All Posts


The little SAS program’s official name was Extract_Transform_Load_ 0314.sas. But, that name was much too formal, way too long, and did not roll off of the tongue very easily at all. So, everybody simply called her: ETL Pi. ETL Pi was conceived in a 2-hour project strategy meeting in conference


여러분은 어떻게 쇼핑하나요? 온라인 쇼핑몰, 모바일 앱, 소셜 미디어 등 디지털 기술의 발전과 함께 현대인의 쇼핑 방법은 점점 더 다양해지고 편리해지고 있습니다. 동시에 기업이 고객과 만나는 접점은 그 어느 때보다 많아졌는데요. 그만큼 기업의 디지털 마케팅 전략 또한 여러 기술 요소와 방법론이 혼용되는 하나의 큰 생태계로 발전을 거듭하고 있습니다. 그 생태계의 기반에 디지털
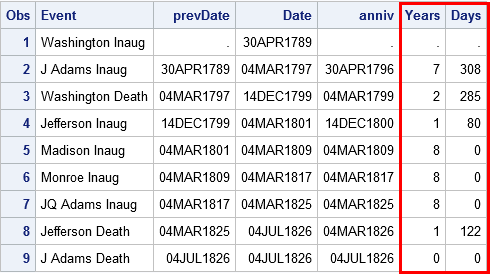

Last week I showed a timeline of living US presidents. The number of living presidents is constant during the time interval between inaugurations and deaths of presidents. The data was taken from a Wikipedia table (shown below) that shows the number of years and days between events. This article shows
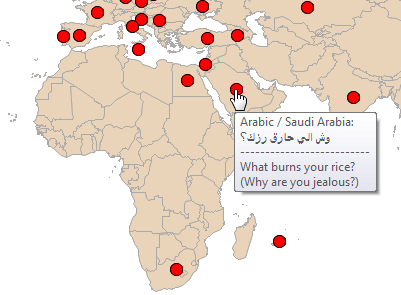

An idiom is a group of words established by usage as having a meaning not deducible from those of the individual words. For example, "don't cry over spilled milk," or "the cat is out of the bag." Idioms are fun to use, and fun to hear - don't you agree? And


I. Situación del Cliente El esfuerzo de utilizar datos para probar los errores de cálculo de la garantía involucraba demasiado tiempo, sin embargo al calcular la estimación de energía perdida del año anterior, Jerry Williams, Gerente del Programa de Sustentabilidad Ambiental de SAS cambió su perspectiva. La decisión se basó


Ivor Moan explains how SAS Data Management software can help you address GDPR requirements.


When a busy university analytics team is tasked with creating a new, interactive way to share data with dozens of different constituents, data visualization from SAS is the obvious answer. The University of Idaho’s office of Institutional Effectiveness and Accreditation is the source for comprehensive information, analyses and university statistics.


Jim Harris explains why data quality is such a fundamental aspect of master data management.


May is Global Employee Health and Fitness Month (GEHFM) and to help recognize the efforts of getting {and keeping} employees happy, healthy and fit, SAS is hosting a 1 Day Clean Eating Challenge on Thursday, May 18th. (If you are participating in GEHFM activities, this counts as one point!)
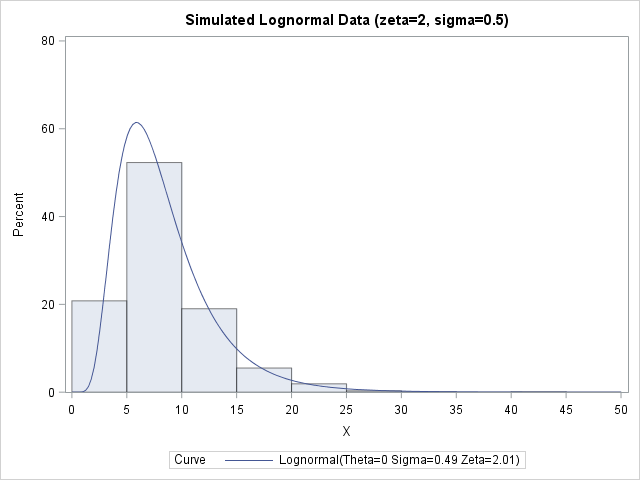
A SAS customer asked how to simulate data from a three-parameter lognormal distribution as specified in the PROC UNIVARIATE documentation. In particular, he wanted to incorporate a threshold parameter into the simulation. Simulating lognormal data is easy if you remember an important fact: if X is lognormally distributed, then Y=log(X)

Water is in the news more & more lately - people seem to either have too much, or too little, at any given time. Therefore being able to plot rivers and lakes on a map could be a very useful skill to add to your graphical bag of tricks. A few
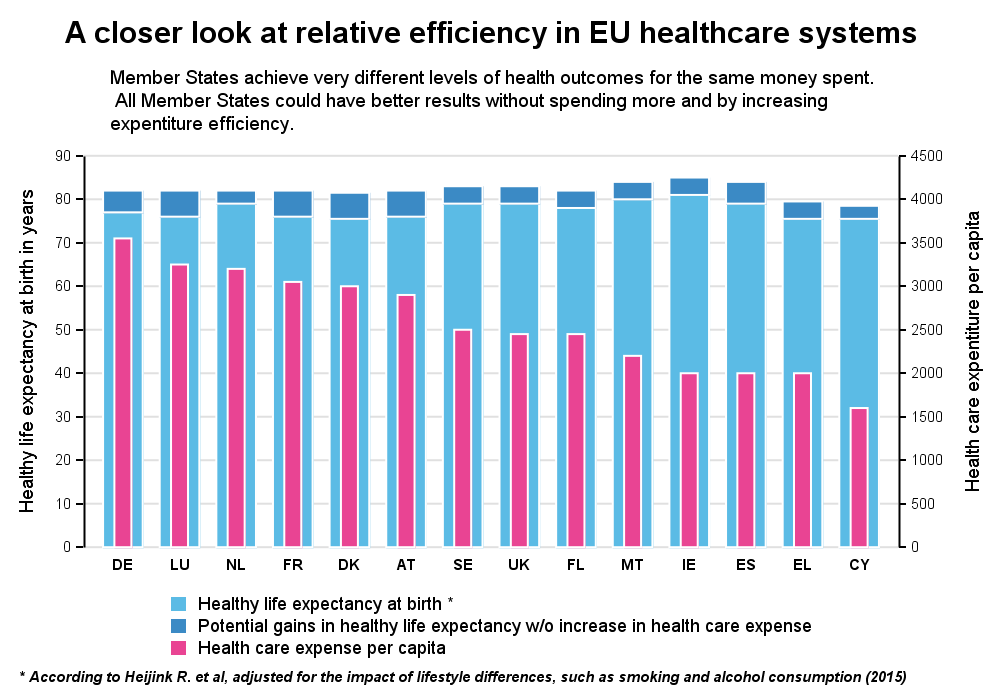

Recently, while browsing health care data, I came across the graph shown below. The graph includes the healthy life expectancy at birth by countries in the EU, along with the associated per capita expenditure. The graph also shows estimate of potential gain in life expectancy by increasing expenditure efficiency. The

When we built our house in Durham ten years ago, I asked the builder if I could make a special request. He was very accommodating. He said he had heard it all. “Can you install a switch to turn off the doorbell?” That he had not heard. His response, “Why
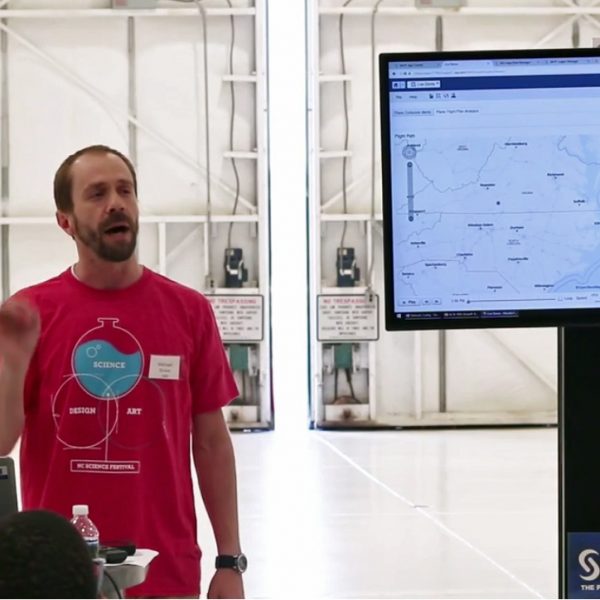

What do you get when you combine analytics, aviation and the Internet of Things? A learning experience that leaves everyone flying high! At Data on the Fly, 25 area high school students had the opportunity to learn how technology has changed – and continues to change – the aviation industry.
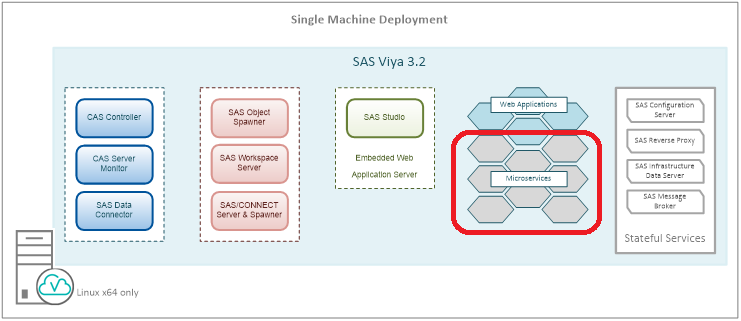

Microservices are a key component of the SAS Viya architecture. In this post, I’ll introduce and explain the benefits of microservices. In a future post we’ll dig deeper into the microservices architecture. What are microservices? When we look at SAS Viya architecture diagrams, we can find, among the new core components,