Refining your data for effective reports is even easier in the 8.1 release of SAS Visual Analytics. In this blog post, I’ll take a look at the data pane, how it displays data from your active data source, and a few tasks that you might want to perform, such as viewing measure details, changing data item properties, and creating geographic data items, hierarchies, and custom categories. In a future blog, I’ll look at creating filters, new calculated data items, and calculated aggregations.
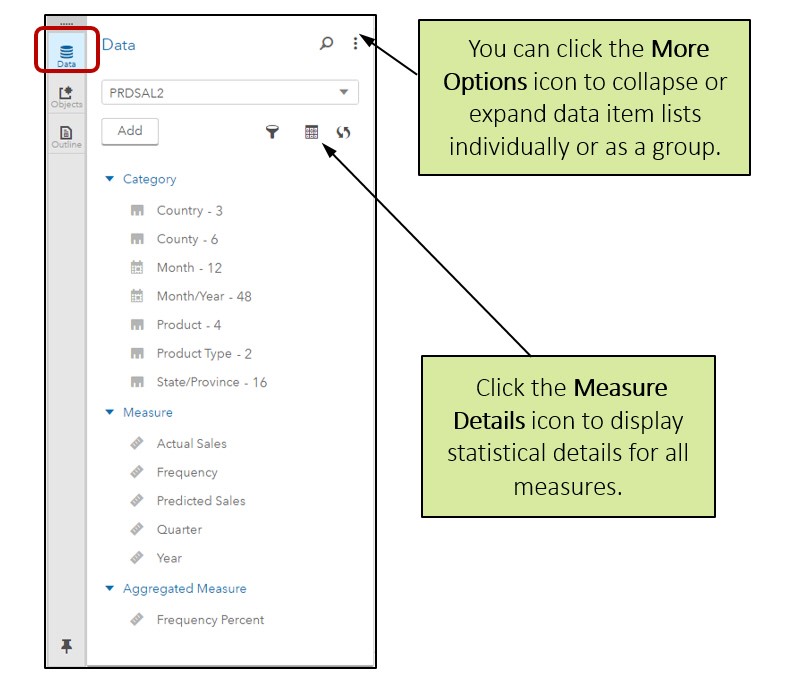
In the SAS Visual Analytics interface, you can display the Data pane by clicking the Data icon on the left menu.
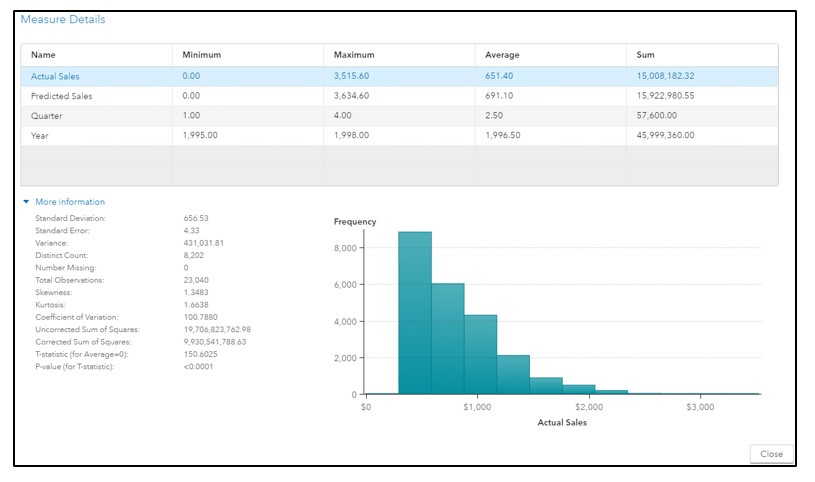
Measure details
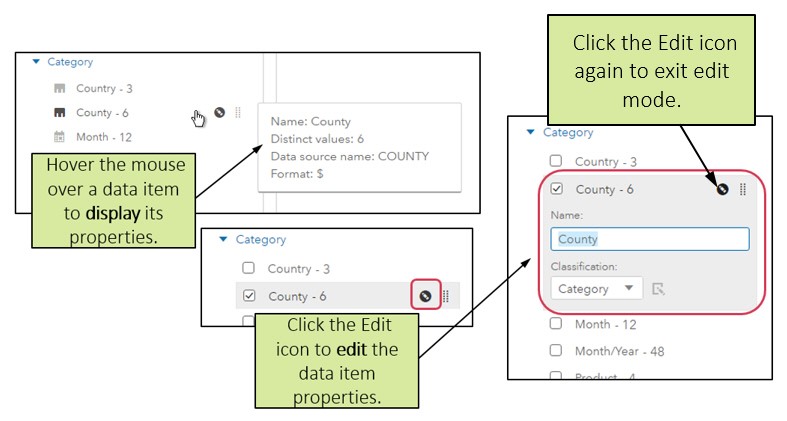
You can view data item properties and make these changes:
- The name of a data item.
- The Classification of Measure or Category data item.
- The format of a Measure or Date/Time/Datetime data item.
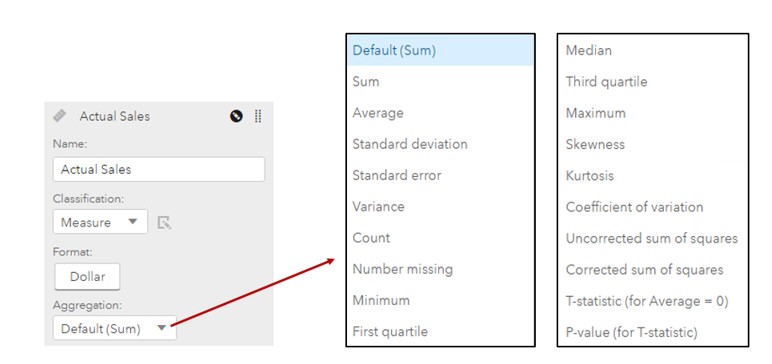
- The aggregation of a Measure data item.
- Note: User-defined formats for Category data items are honored, but cannot be changed. The user-defined format must be available to the CAS server where the data is loaded.
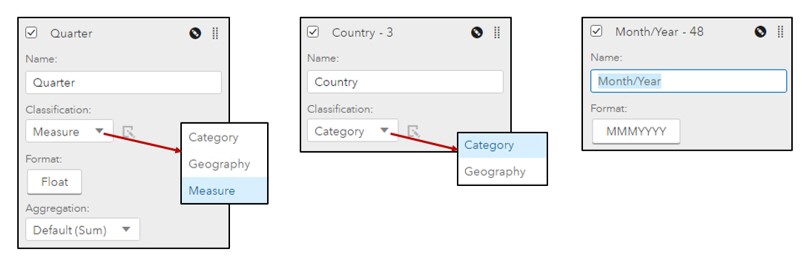
A Measure classification can be changed to Category or Geography. A Category classification can be changed to Geography. Date and Tim classifications cannot be changed.
You can modify the aggregation for a Measure data item:
You can modify measure formats:
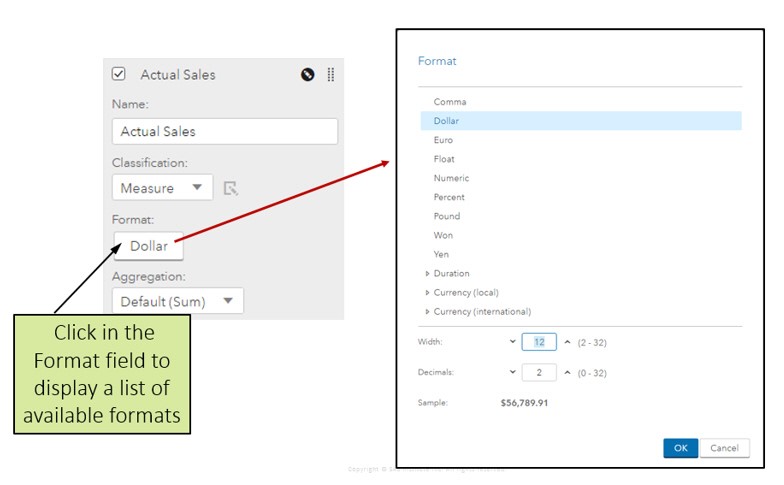
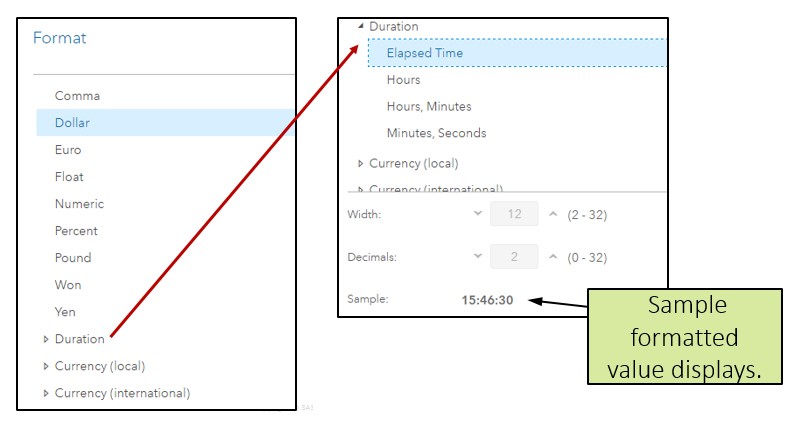
- You can expand to display available Duration and Currency formats.
- Over thirty different Currency formats are available for local or international currency. (Example: $56,790 or USD56,789)
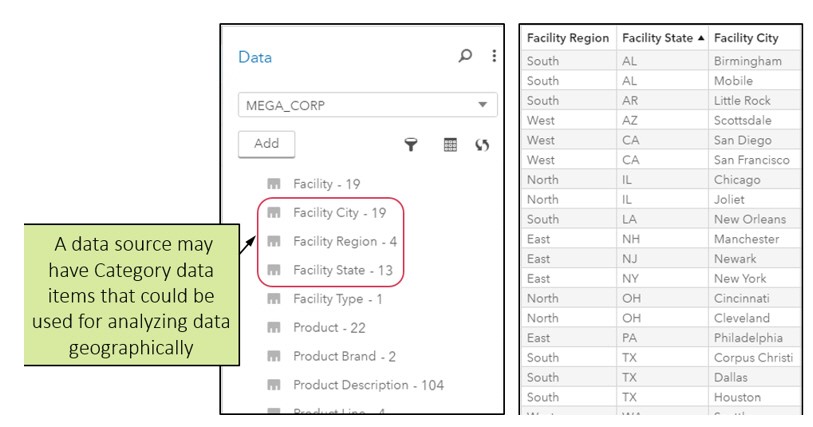
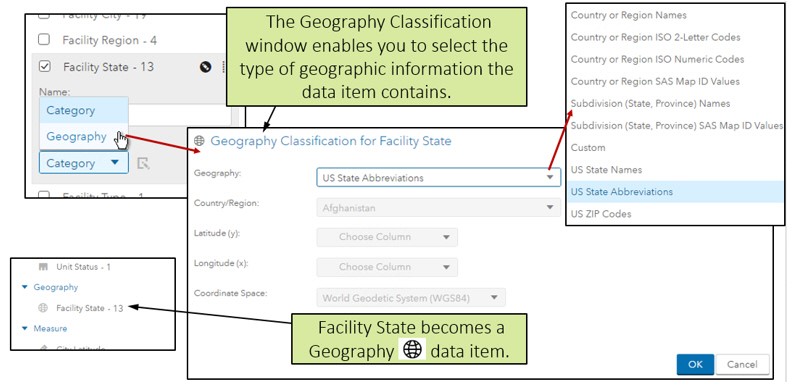
Geography data items identity a geographic region or location, and are typically used to visualize data on a geographic map.
- You can create geography data items by using predefined geography classifications such as countries or states.
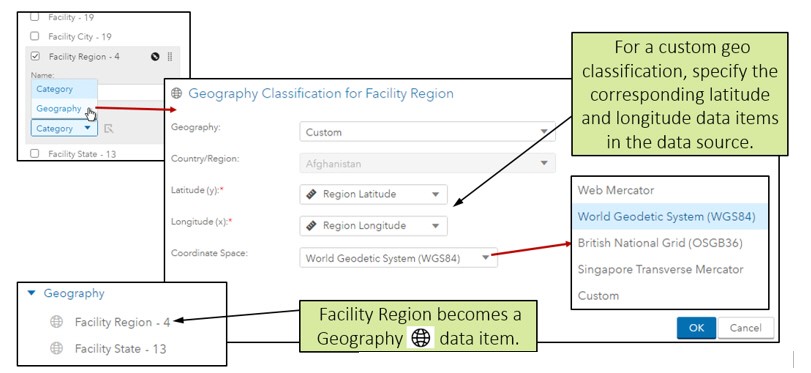
- You can create a custom geographic classification by providing latitude and longitude coordinates in your data source.
- For predefined classifications, the values of your category data items must match the lookup values documented here.
Designating a Geography data item:
Designating a custom Geography data item:
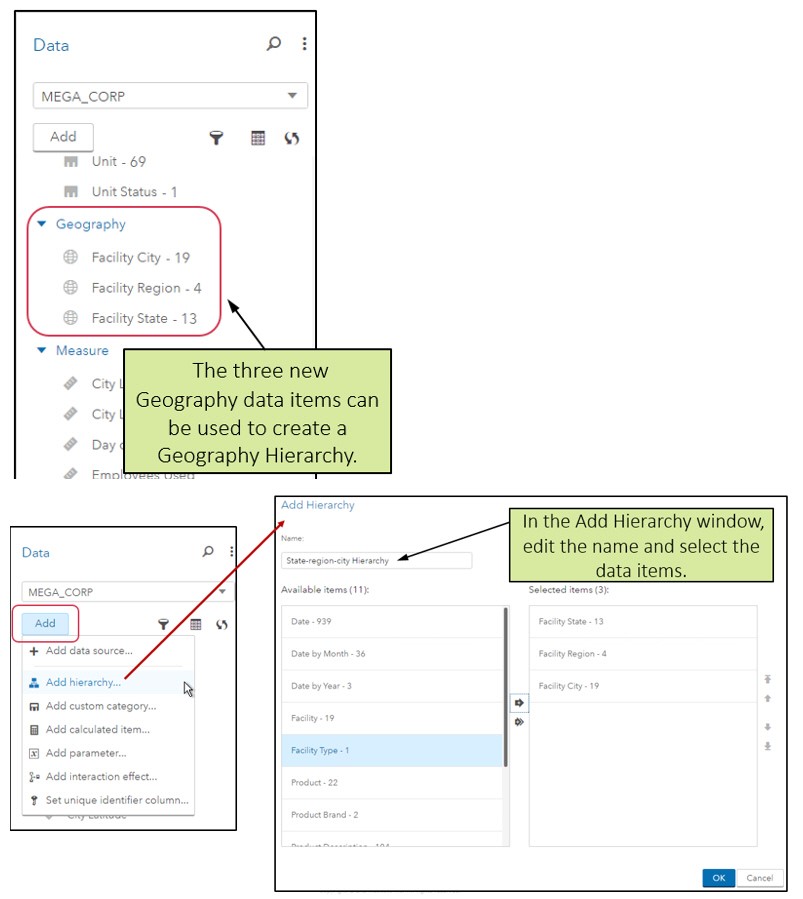
A hierarchy enables you to add drill-down functionality to a report.
- A hierarchy can display information from general to specific.
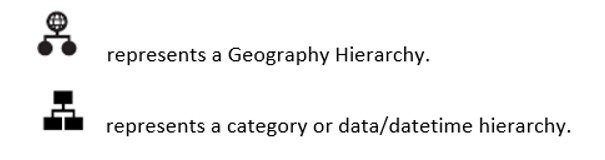
- You can create category, date/datetime, or geography hierarchies.
- Not all report objects support all types of hierarchies.
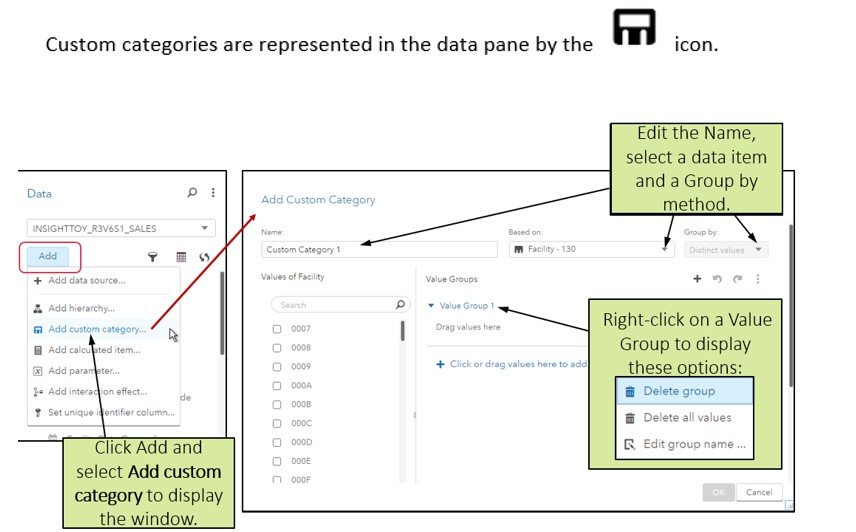
- A custom category is a category data item which associates a set of alphanumeric values with intervals, ranges, or specific values of a data item.
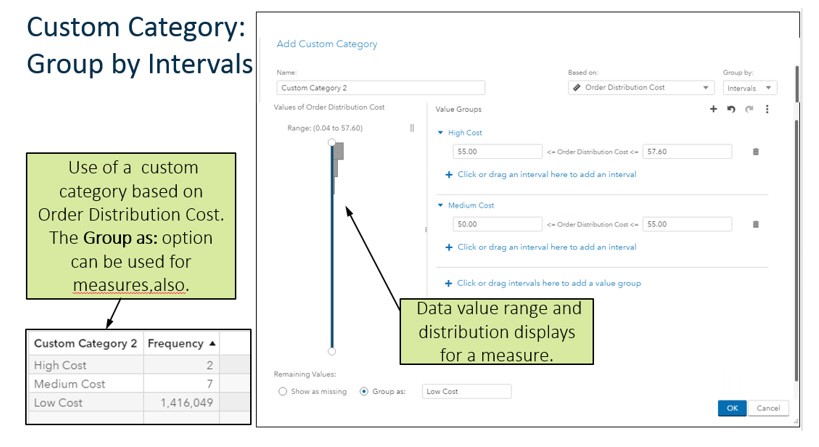
- A custom category can be based on a category or a measure data item.
- A custom category can provide functionality in a report similar to that of a user-defined format—without having to have a format previously associated with the data item.
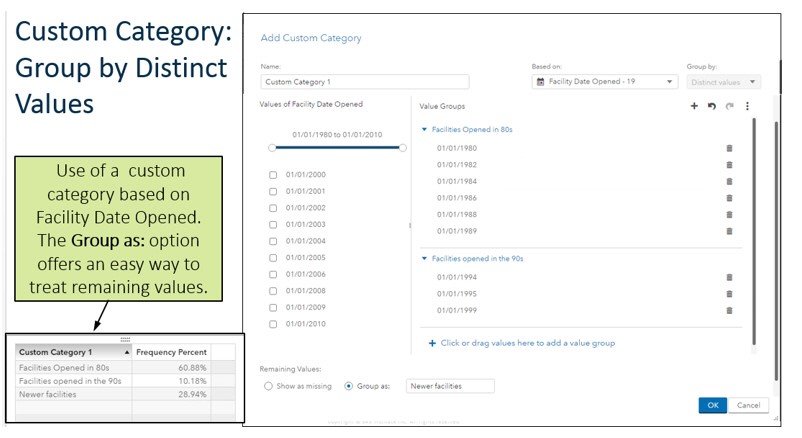
Example:
1-20 = ‘First group’
21-30 = ‘Second group’
31-40 = ‘Third group’
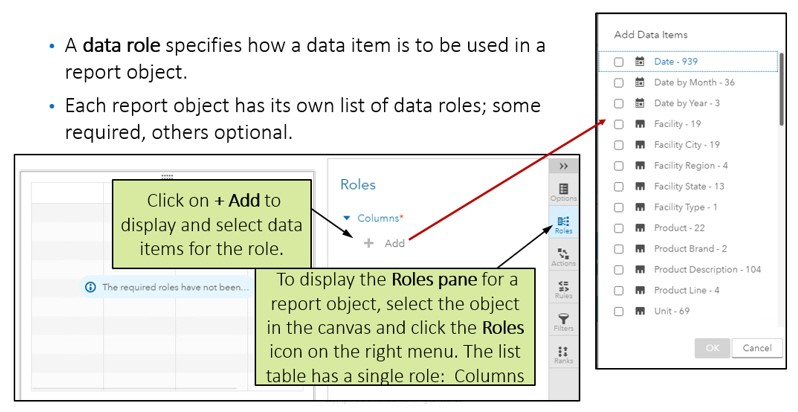
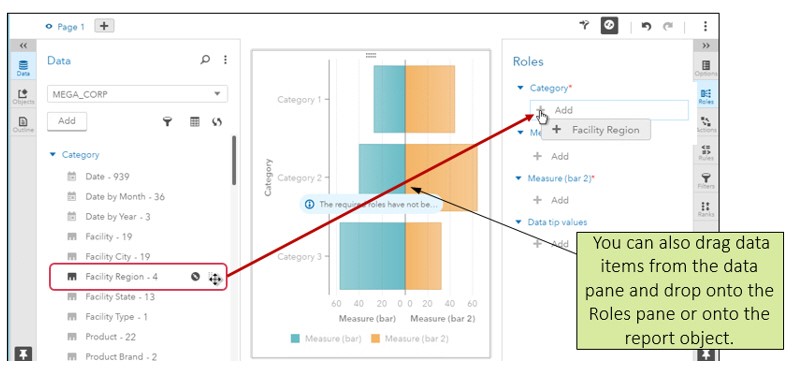
Depending on the report object, some roles require only one value; other roles may require multiple values.
You can right-click on a data item in the Roles pane to remove the data item from a role.
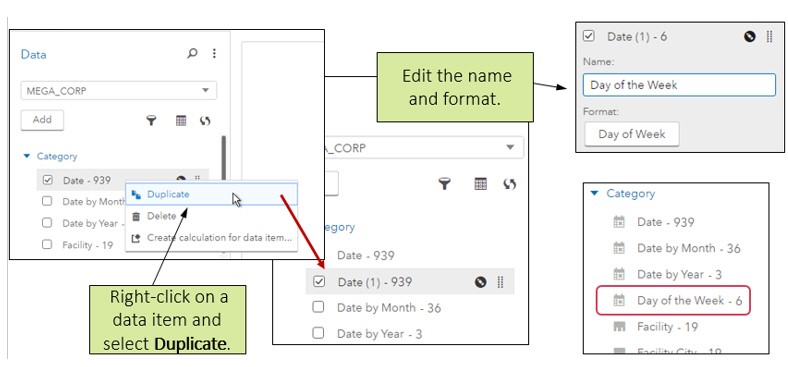
Duplicating a data item can enable you to display data in two different ways.
Duplicating the Date data item with 939 different values can enable you to create a report that analyzes production on each day of the week: Monday, Tuesday, Wednesday,…
Duplicating a measure data item can enable you to use the column as a category data item in reports as well.
Note: You can only delete data items that you have created, such duplicated data items or calculated data items. Deleting a data item means that it no longer appears in the data pane.
This covers many of the basic tasks that you can complete in the new data pane. In my next blog, I’ll take a look at the visual and text editors for creating filter expressions and calculated items and aggregations in the data pane.