All Posts


The Dw.p format displays numeric values, in a field w positions wide, possibly with a great range of values, lining up decimals for values of similar magnitude. The BESTDw.pformat combines the BESTw. format for integers and the Dw.p format for nonintegers. Specifying BESTDw.p (where p = w - 1) is better than specifying BESTw. for columns, since decimals do not shift when the last digit is 0.

When SAS Add-In for Microsoft Office was first created over a decade ago, SAS programmers were told to check their skills at the door. This new product was for non-programmers only. SAS programmers were invited to contribute to the experience by packaging their code in SAS stored processes, which end


Hay que decir las cosas como son: los consumidores de hoy pueden ser despiadados. ¿Y quién podría culparlos por tener semejante inclinación? Simplemente disfrutan el mundo en el que les tocó vivir: una economía global que, gracias a su alto nivel de digitalización, permite adquirir productos o servicios desde cualquier
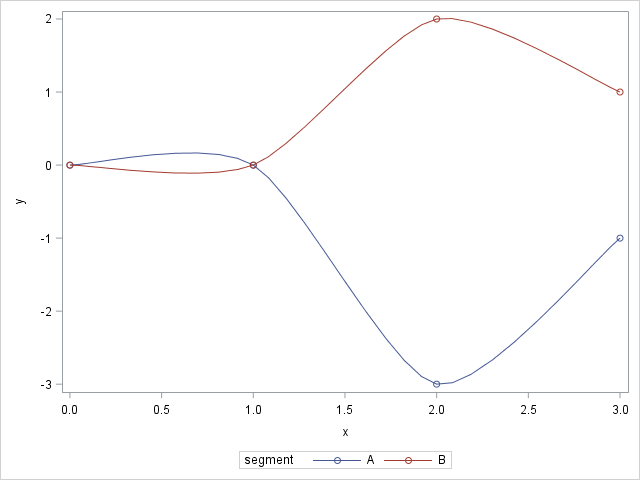

By default, when you use the SERIES statement in PROC SGPLOT to create a line plot, the observations are connected (in order) by straight line segments. However, SAS 9.4m1 introduced the SMOOTHCONNECT option which, as the name implies, uses a smooth curve to connect the observations. In Sanjay Matange's blog,
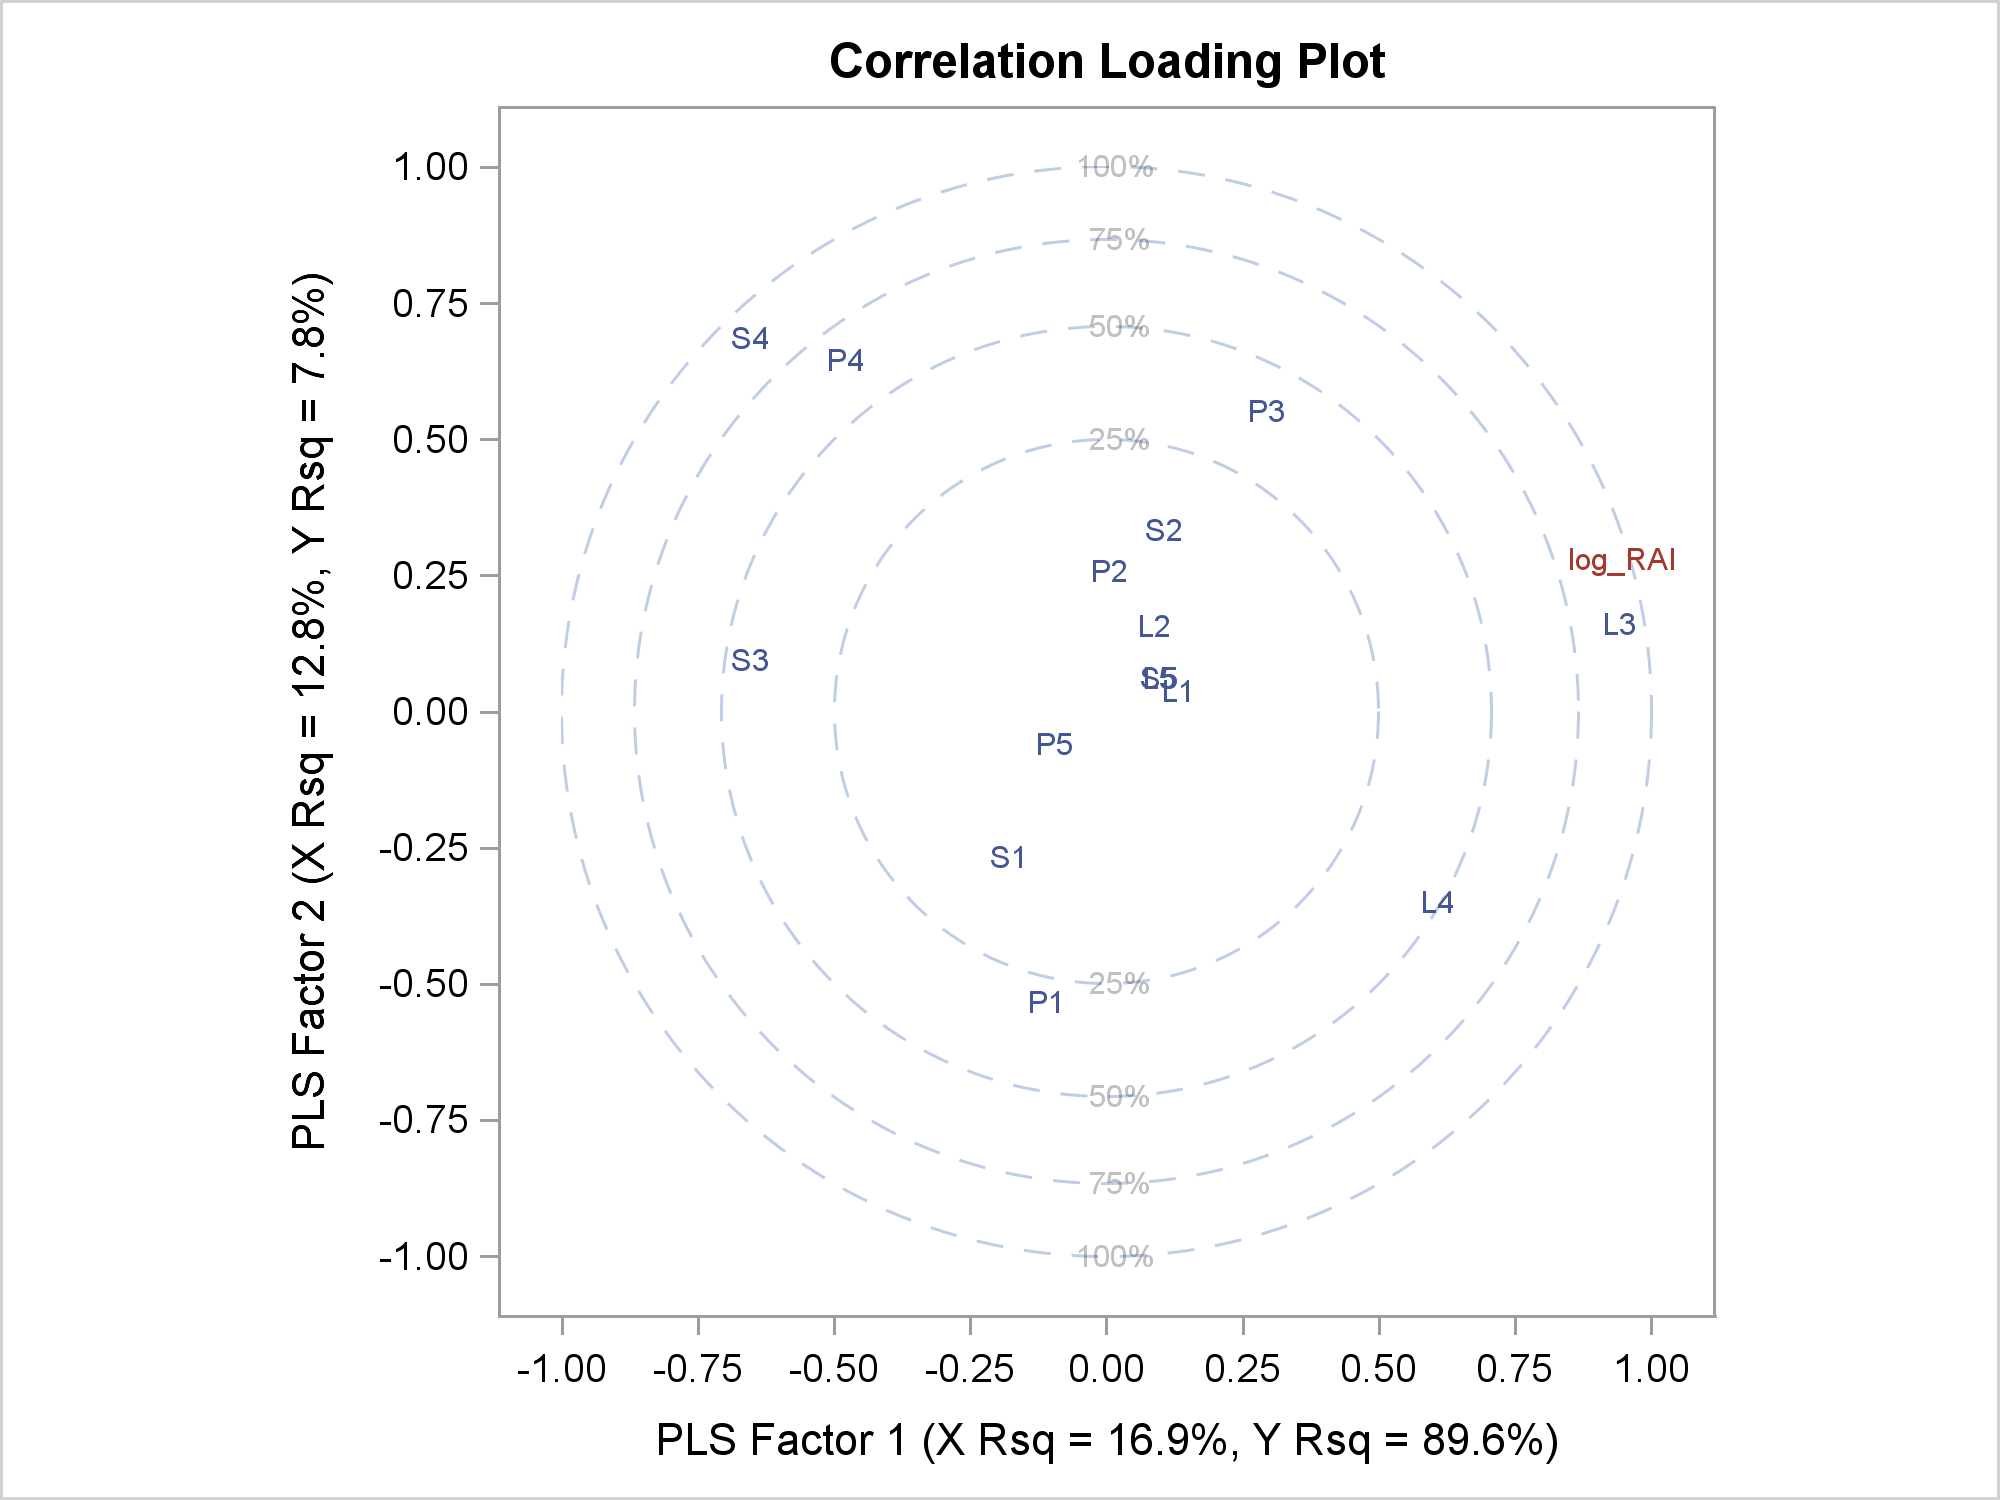
When the data object that underlies a graph is not quite in the form that you want, you might be able to use GTL expressions to produce precisely the graph that you want.
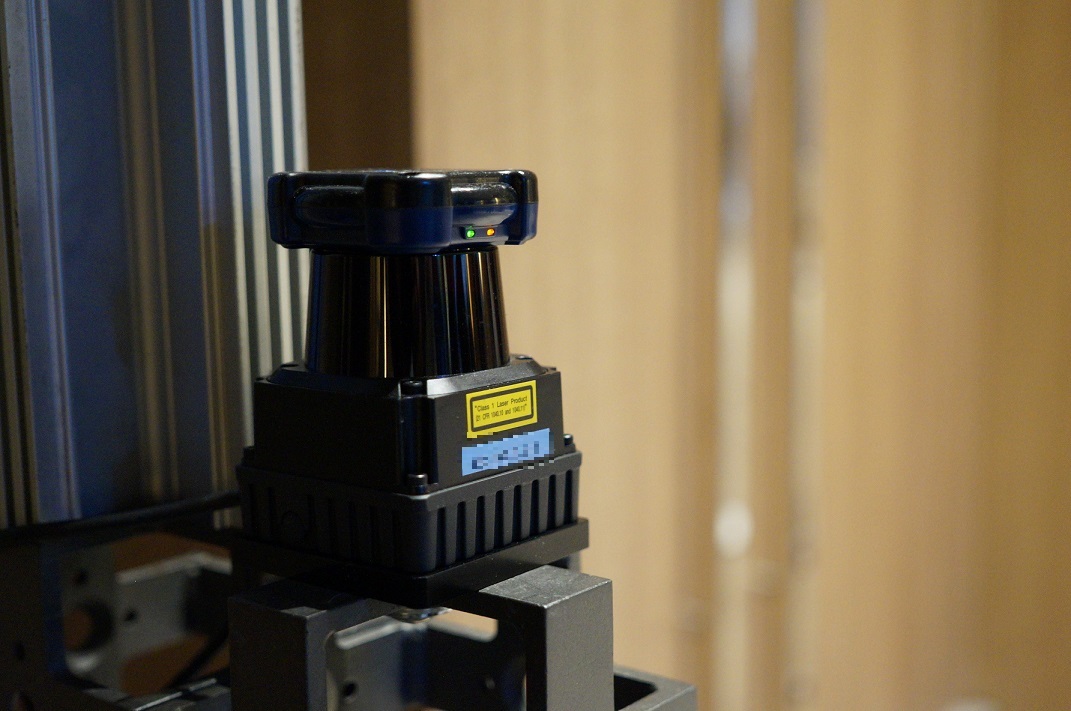

SAS Forum Japan 会場自体がデモスペースへ SAS Forum Japan 2017では、株式会社ATR-Promotionsにご協力いただき、会場2Fのスペースにレーザーセンサーを設置、人の動線をリアルタイムに捉えて計測・分析するIoTデモンストレーションを実施しました。 会場で利用した「人位置計測システム」の計測イメージ参考映像。(※こちらはSAS Forum Japan の映像ではありません) 利用した技術について 利用技術①センサー LRF:レーザーレンジファインダ(安全な出力の赤外線レーザー) 利用技術②人位置計測システム ATRacker レーザーセンサーを複数台設置し、人々の位置・行動を、1秒間に数十回計測したデータを、ATR-Promotions社ソフトウェアの人位置計測システム「ATRacker」の形状認識・行動推定アルゴリズムで動線データ化しています。 特徴) 高精度(距離20mで誤差5cm以内のセンサを使用して計測、追跡) 形状認識(腕の位置などを利用して身体、身体の向きも捕捉) 行動追跡(同一人物を追跡。統計モデルによりレーザが遮られても位置を予測) 匿名性の確保(カメラと異なり顔や服装を捕捉しない) 大人数の同時計測(同時に50人以上の位置を計測、追尾) リアルタイム処理 外部プログラム連携 参照) http://www.atr-p.com/products/HumanTracker.html http://www.atr-p.com/products/pdf/ATRacker.pdf 利用技術③SAS® Event Stream Processing(略称 SAS ESP) リアルタイムでストリーミングデータを処理するSASソフトウェア。 ATRackerよりストリーミングでデータをリアルタイムに取得し・追加処理しています。今回の展示例では、特定の位置に人が急速に近づいた場合に、リアルタイムアラートを発します。 参照) https://www.sas.com/ja_jp/software/event-stream-processing.html 利用技術④利用したハードウェア AFT:The Analytics Fast Track™ for SAS® 最新のビッグデータ・アナリティクスを、自社データですぐに試す為に用意されたハイスペックマシン。 必要なSASのビッグデータ・アナリティクス製品がインストール&構成済みであり、スイッチを入れて、データを投入すれば、すぐに使える状態にしております。 POC等の実施に際し、当マシンを貸し出すことで、POC環境の用意をわずか数日で揃えることが可能です。 72


How many times have you entered a phone number on a web page, only to be told that you did not type it the "correct" form? I find that annoying. Don't you? In my latest book, Cody's Data Cleaning Techniques, 3rd edition, I show how to convert a phone number
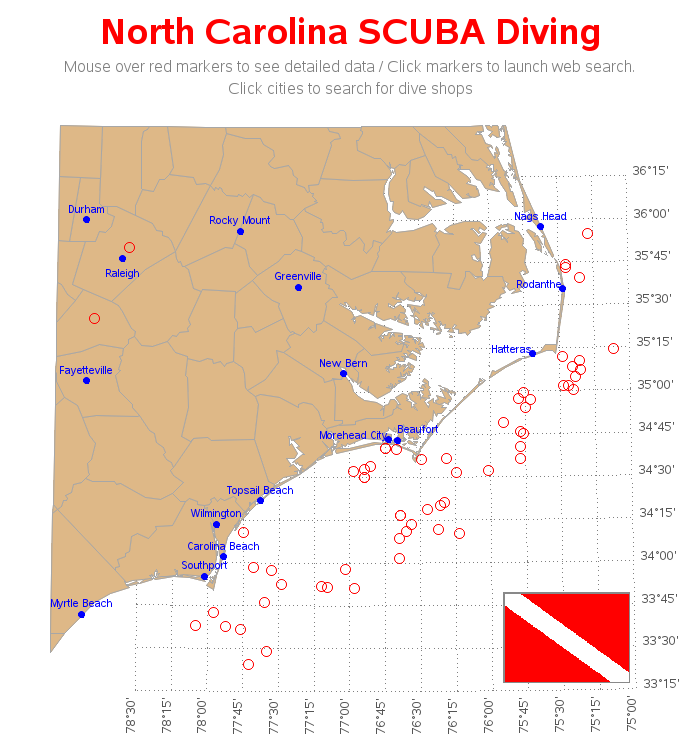

North Carolina is a very diverse state - especially when it comes to outdoor recreation opportunities. This weekend you could go hiking or kayaking in the mountains, watch a hot air balloon festival near Raleigh, and go wind surfing or fishing at the coast. And if you've got your SCUBA
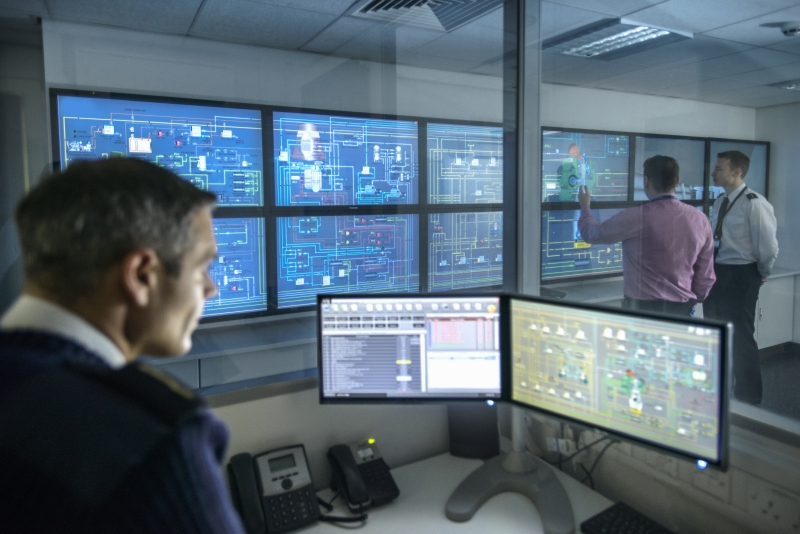

Citizens served by the government are increasingly the same digital savvy consumers that market disruptors in banking, retail and utilities are attracting with sophisticated, data-driven online experiences. It’s a mutually beneficial arrangement; consumers get to buy services in ways that suit them while businesses get the efficiencies they want, wrestling


Elizabeth is courageous. Scoliosis since birth, corrective spinal surgery replaced her spine with steel, tripping on stairs permanently broke her right ankle. Then she decided to come take yoga with me. To help ease back pain & reduce hip stress, I offered options like bent legs not cross. In class
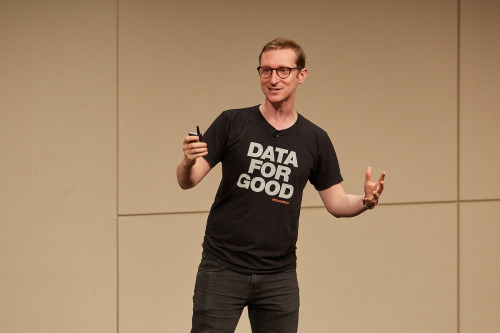

Thanks to 100 dedicated volunteers who spent their entire weekend digging into data at North Carolina’s first-ever DataDive: The Anti-Defamation League was able to cite the new approaches it was taking to analyzing hate crime data when its CEO testified before the US Senate in early May. Counter Tools, a
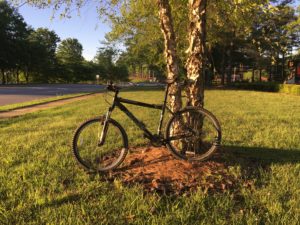

Among the many celebrations observed this month, May is National Bike to Work Month. If you’ve always wanted to commute by bike, this is a great time to give it a try. Depending on your specific location across the globe, the weather here in Cary, NC is typically mild in May


오늘은 SAS에서 오랫동안 근무해온 프로그래머이자 데이터 사이언티스트의 SAS Viya 사용 후기를 공유해 드리려고 합니다. 새롭게 출시된 ‘SAS Viya(SAS 바이야)’ 환경을 사용해 본지는 이제 6개월이 지났는데, 벌써 푹 빠졌다고 합니다! SAS9 환경에서 사용했던 많은 통계 기법을 SAS Viya 환경에 동일하게 적용했을 때 그 속도와 더 높은 정확성에 감격했답니다. 그렇다면 데이터 사이언티스트가
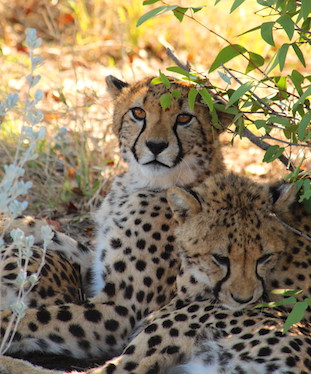

Around the world, animals continue to be added to the endangered species list. Thankfully, there are organizations like WildTrack, a nonprofit organization using non-invasive techniques to monitor endangered species. With the help of SAS® technology, WildTrack can use its collection of data to preserve endangered species and improve conservation efforts.


Phil Simon chimes in on the last five years of Hadoop with an eye toward the future.