All Posts


Most SAS regression procedures support a CLASS statement which internally generates dummy variables for categorical variables. I have previously described what dummy variables are and how are they used. I have also written about how to create design matrices that contain dummy variables in SAS, and in particular how to

SAS Data Connector to Oracle lets you easily load data from your Oracle DB into SAS Viya for advanced analytics. SAS/ACCESS Interface to Oracle (on SAS Viya) provides the required SAS Data Connector to Oracle, that should be deployed to your CAS environment. Once the below described configuration steps for


Billy Beane attained fame in baseball and analytics circles long before Brad Pitt portrayed him in the 2011 film Moneyball. In fact, Beane was making quite the name for himself prior to Michael Lewis’s 2004 book of the same name. It’s no overstatement to claim that, as general manager (GM)


If you're a SAS programmer, you have likely used loops in your SAS code to make life easier from time to time. In this blog post, I demonstrate a few ways you can use loops to do clever things in your graph code. Perhaps even the old dogs can learn


When developing SAS® data sets, program code and/or applications, efficiency is not always given the attention it deserves, particularly in the early phases of development. Since data sizes and system performance can affect a program and/or an application’s behavior, SAS users may want to access information about a data set’s


Todd Wright explains what GDPR means and shows how SAS can help you prepare for it.


This May is Global Employee Health and Fitness Month. For #GEHFM the Work/Life Center is embracing the theme of Wholehearted Living. Wholehearted living is a concept developed by writer and research professor, Dr. Brené Brown. Wholehearted living can be seen in behaviors that promote physical and emotional self-care, gratitude, compassion, mindfulness and
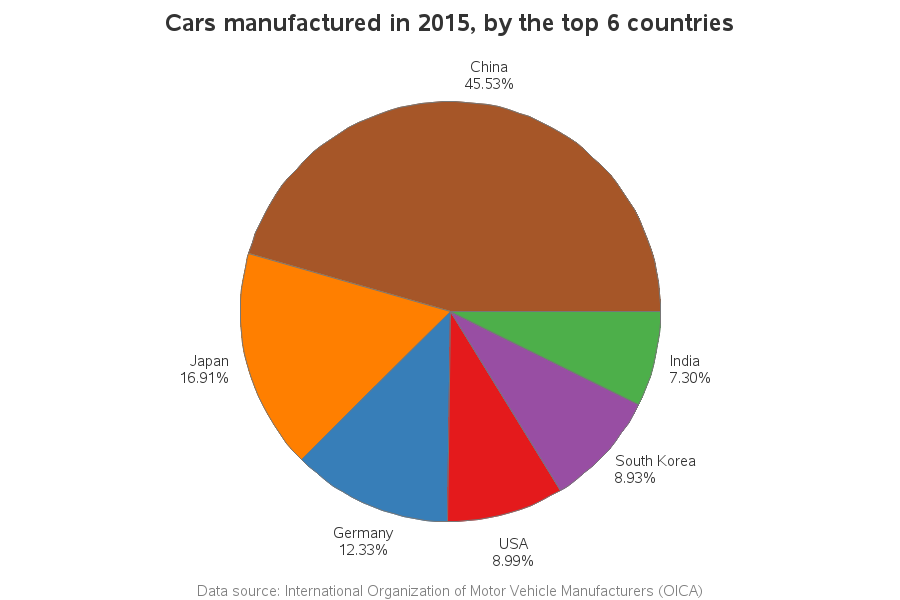
Building cars is towards the top of the manufacturing hierarchy - some countries are even known for the cars they build. If you want a good quality car, you probably think of Japan. If you want a stylish sports car, you probably think of Italy. If you want a diesel


David Loshin explains 4 struggles of syndicating master data across the enterprise.
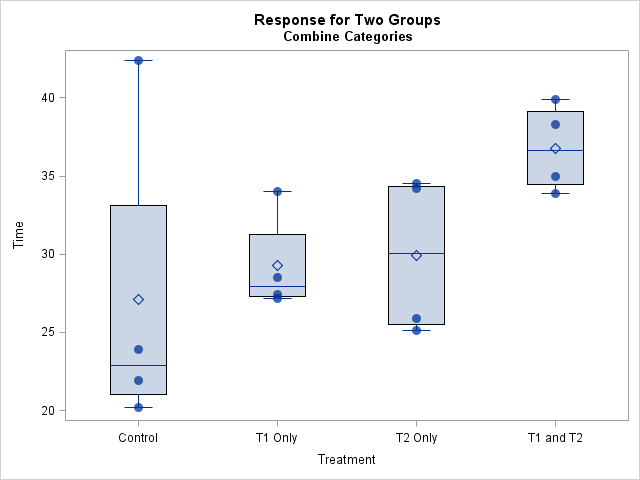
There are several ways to visualize data in a two-way ANOVA model. Most visualizations show a statistical summary of the response variable for each category. However, for small data sets, it can be useful to overlay the raw data. This article shows a simple trick that you can use to
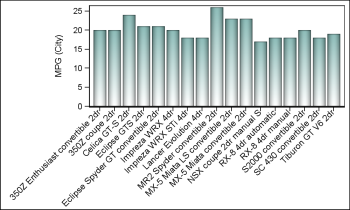

Fitting of long category values on a x-axis is usually a challenge. With SAS 9.4, the SGPLOT procedure tries to fit the values by first splitting the values at white space to see if the values will fit in the space available. This normally works well for a small number
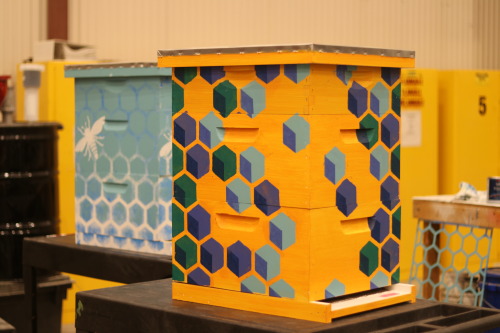

30,000 new employees start work today in one of SAS’ sweetest acquisitions to date. Bee Downtown, a North Carolina-based company using businesses in cities to help save honey bee populations, will install two hives on SAS world headquarters campus, bringing with them 30,000 - 40,000 new honey bees. Bee Downtown-sponsored
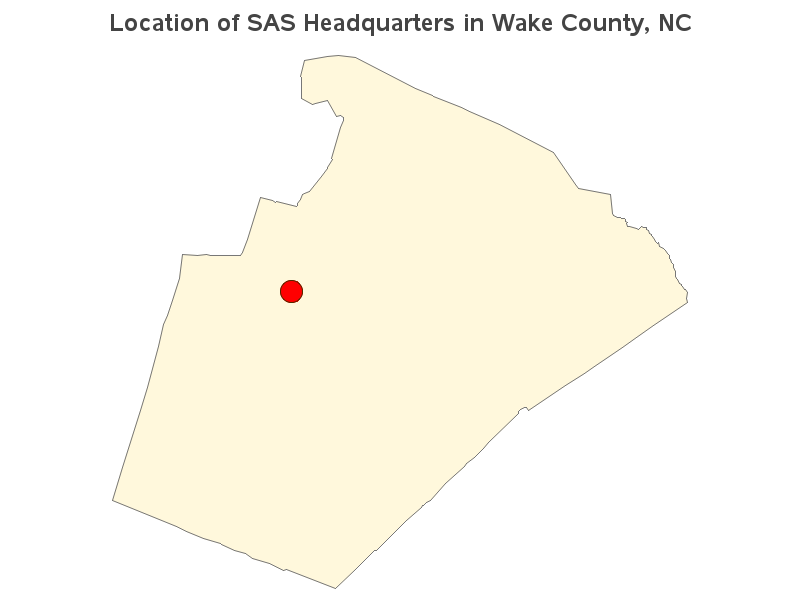
You've got a database containing the addresses of all your customers ... but how can you plot them on a map or analyze them spatially? First, you'll need to convert the address into a numeric coordinate (latitude & longitude). SAS can do that ... with Proc Geocode! But before we

When using the SAS® system to email graphics output, a common request is to use SAS to send an email in which the graphics output is embedded in the body of the email. This functionality is not available until the second maintenance release for SAS® 9.4 (TS1M2). If you are
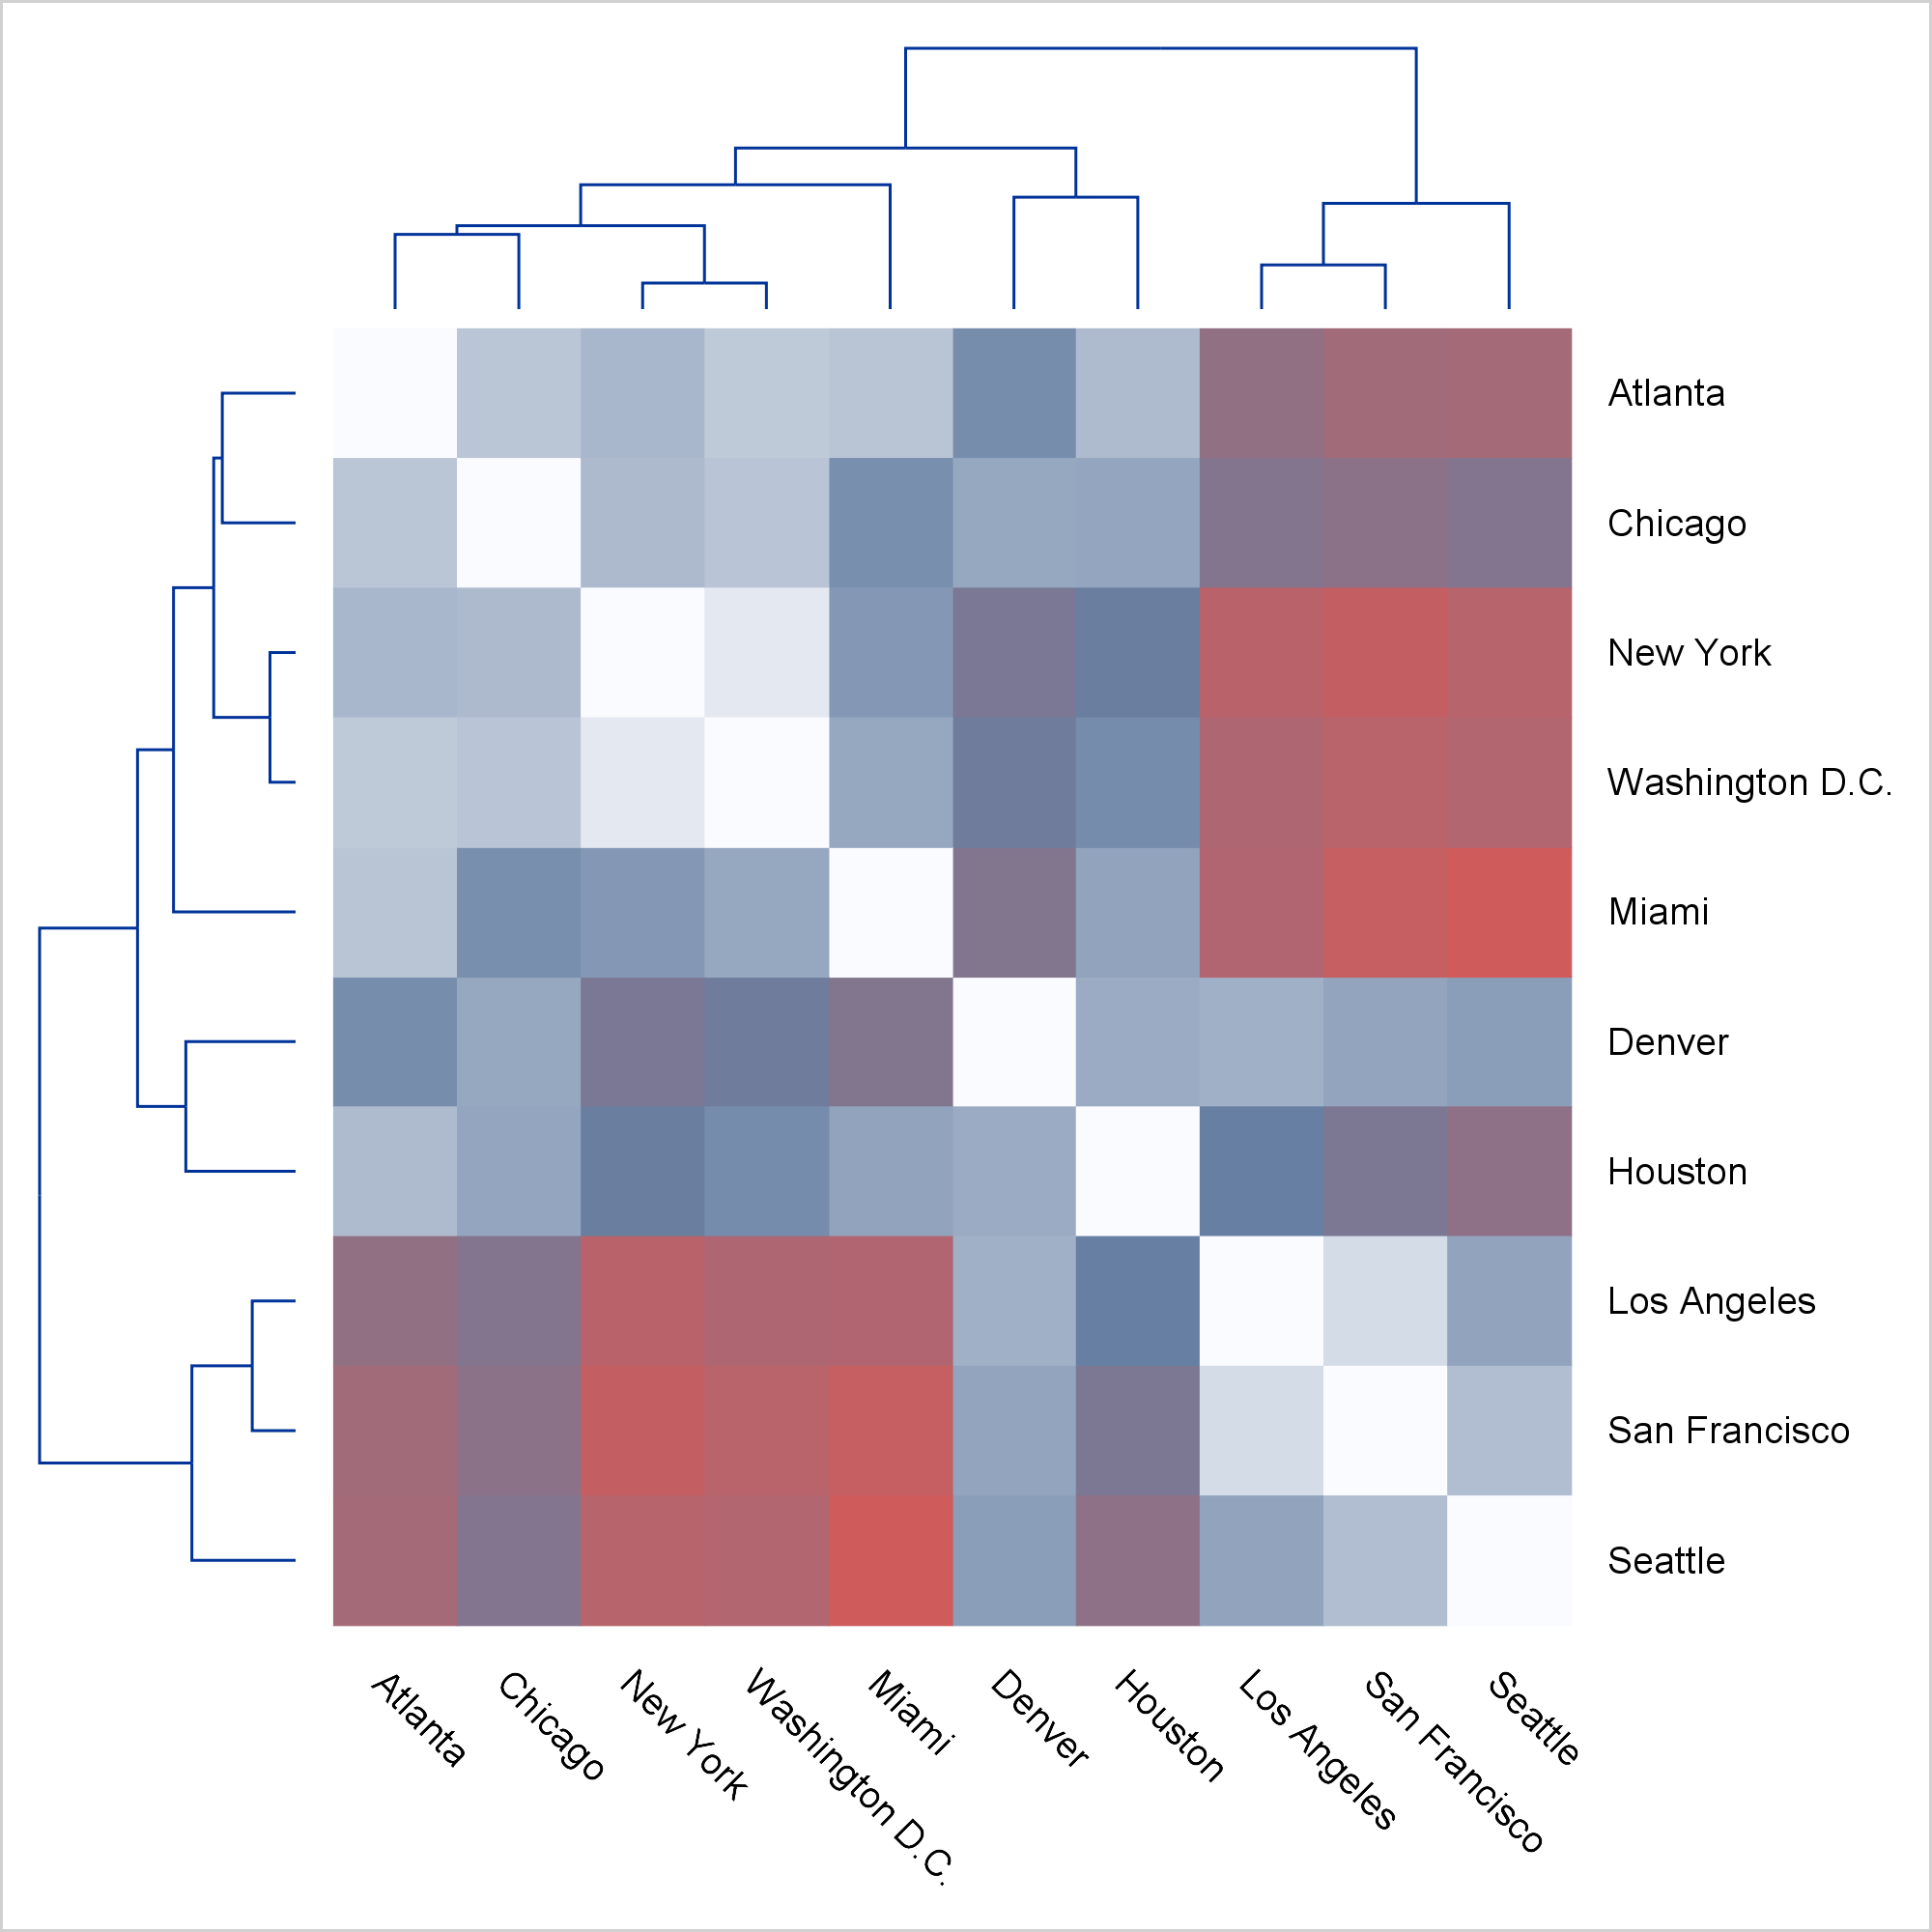

Today, I focus on the steps needed to make a graph that is composed of multiple heterogeneous components (in this case, dendrograms and a heat map).