All Posts


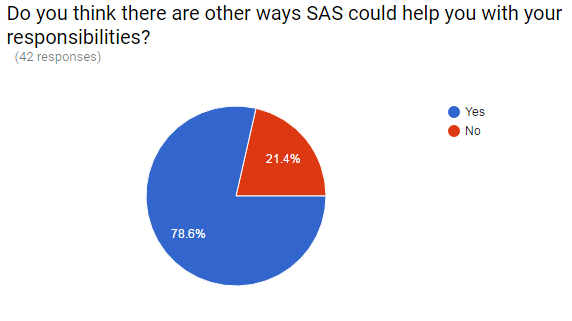
Even if you are a traditional SAS programmer and have nothing to do with cybersecurity, you still probably have to deal with this issue in your day-to-day work. The world has changed, and what you do as a SAS programmer is not just between you and your computer anymore. However,

SAS provides a map for each country, but there are likely other maps you want to use that SAS does not provide. If you have other maps in the Esri shapefile format, you're in luck - you can import those maps and use them! In this blog post I share
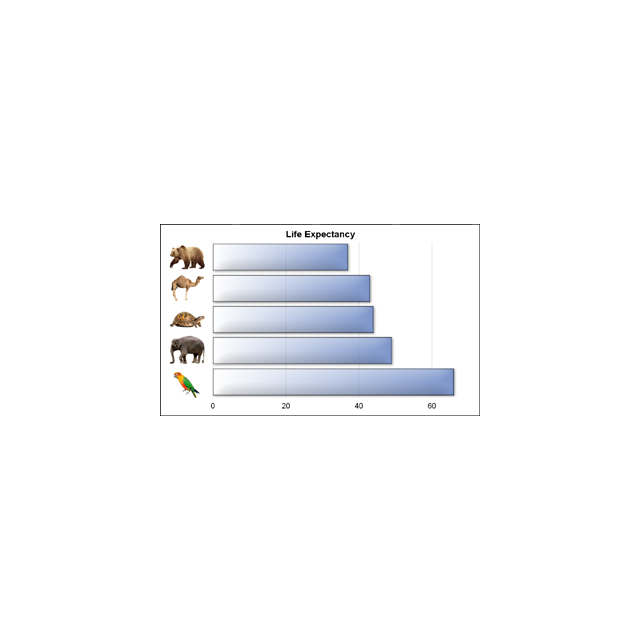

We often say a picture (or graph) is worth a thousand words. So, recursively, this could apply to other text in the graph. I thought it would be interesting to see if we can create a graph with visual categories. Another benefit is that such visual categories are inherently meaningful

I recently asked a SAS user, “Which interface do you use for SAS?” She replied, “Interface? I just install SAS and use it.” “You’re using the SAS windowing environment,” I explained, but she had no idea what I was talking about. This person is an extremely sophisticated SAS user who


I. Situación del cliente El fraude de seguros más común es el de vehículos, incluyendo los accidentes automovilísticos simulados y los reclamos de daños inflados. Con el sistema de detección de fraude adecuado, se pueden ahorrar millones, tal como lo demostró Allianz en República Checa. II. Desafío El desafío que


Jim Harris discusses how the lines between data management and analytics are fading.
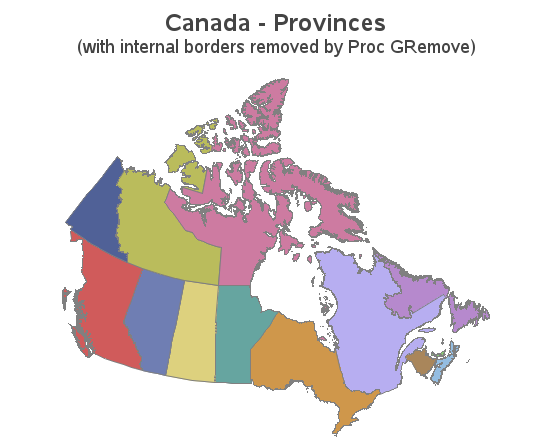
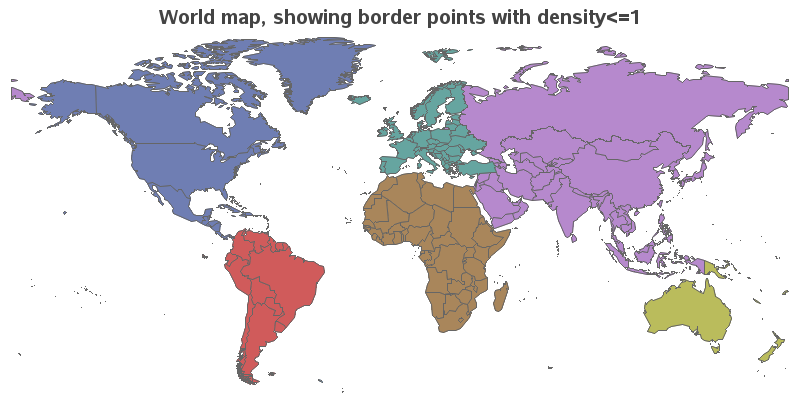
In recent versions of SAS/Graph, we have been shipping new/updated maps of each country, with 2 levels of detail (such as state & county, or province & division). But what if you only want a map showing the higher level of detail? In this blog post I share my third


Finding time to make a home cooked breakfast can be tough…really tough! Especially when you’re bleary-eyed, trying to make sure your socks match and get out of the door on time. And as much as many of us love a warm bowl of tender, creamy and delicious steel cut oats,
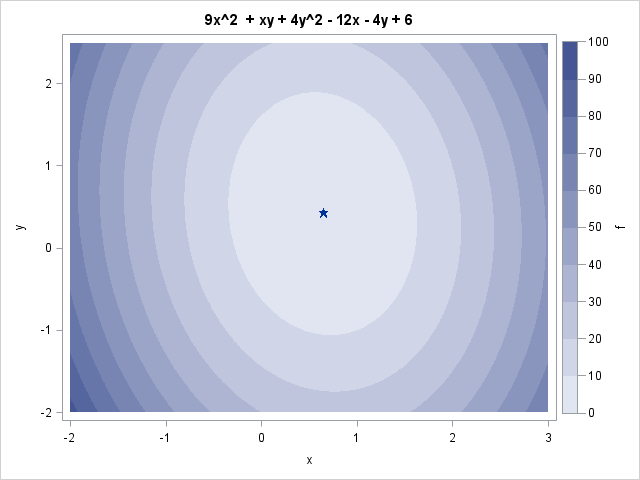

At SAS Global Forum last week, I saw a poster that used SAS/IML to optimized a quadratic objective function that arises in financial portfolio management (Xia, Eberhardt, and Kastin, 2017). The authors used the Newton-Raphson optimizer (NLPNRA routine) in SAS/IML to optimize a hypothetical portfolio of assets. The Newton-Raphson algorithm


La detección de fraudes actualmente radica en la capacidad de observar grandes volúmenes de datos (devoluciones Fiscales) y reconocer patrones en ellos. Una sola devolución de impuestos que reclama el Crédito por Ingresos del Trabajo podría no parecer sospechosa, sin embargo, si 1,500 devoluciones solicitando el crédito son presentadas por

Family-owned and operated for more than 35 years, Twiddy & Company prides itself on exceptional real estate services to homeowners and vacationers in northeast North Carolina and the Outer Banks. Whether a customer is thinking of putting their house up for rent or planning their next vacation, Twiddy makes the
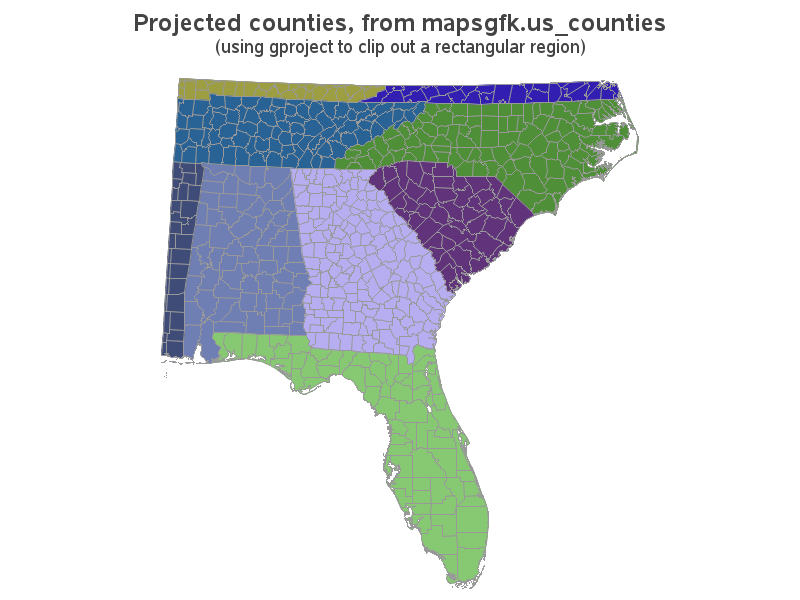
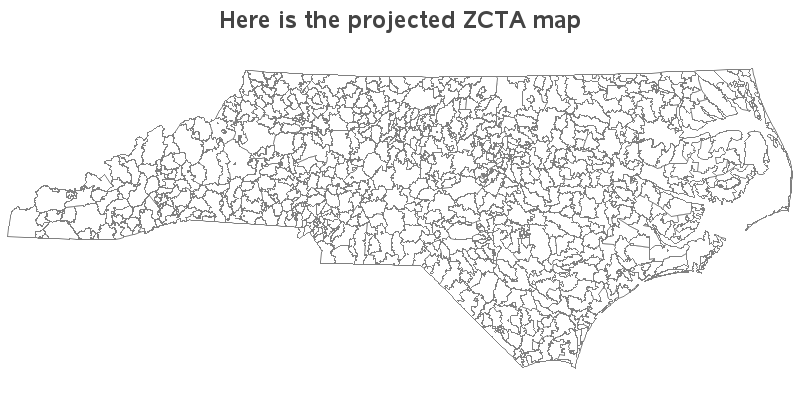
Have you ever seen a map that just didn't look right to you? Perhaps the map area seemed squished or stretched? Perhaps this was because they used a different map projection than you were accustomed to. Or maybe the map coordinates weren't projected at all. In this blog post I
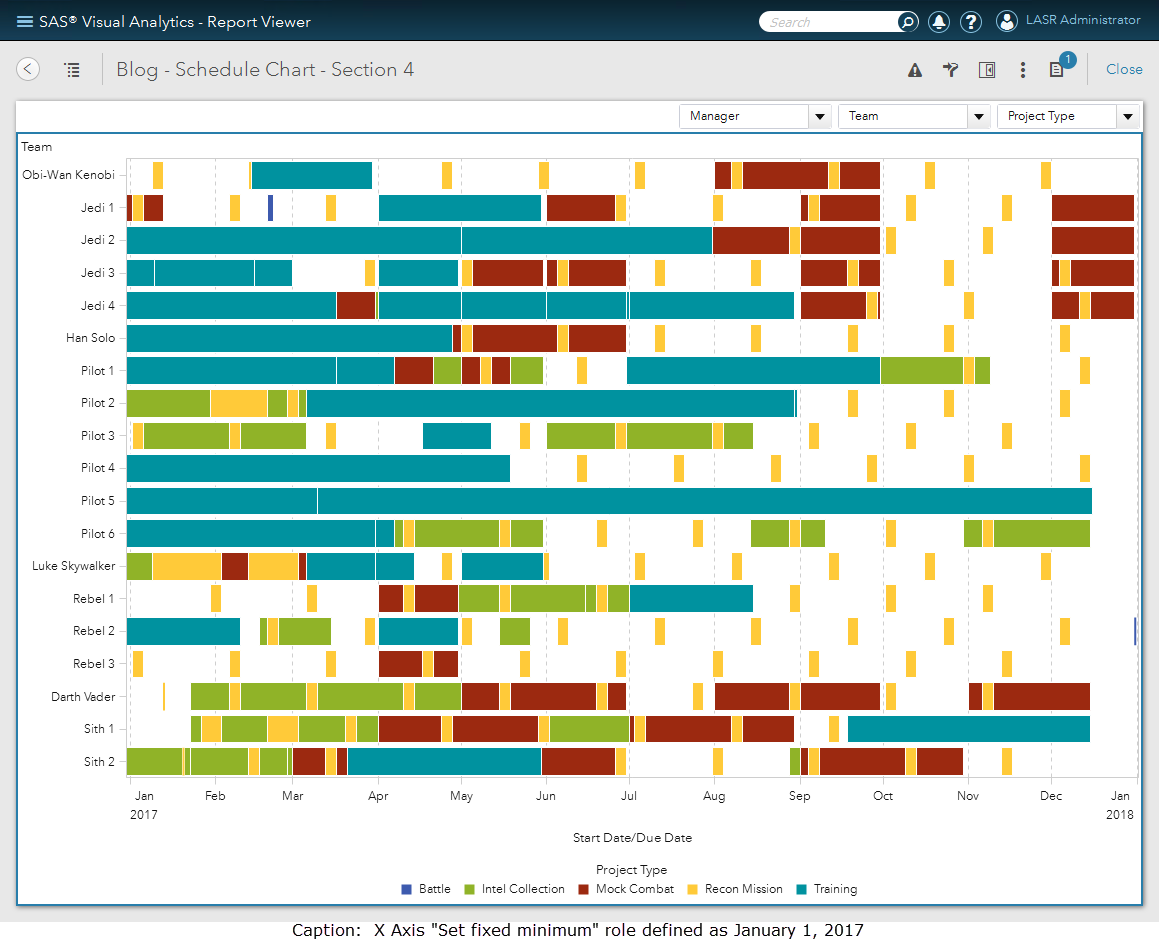

You may be wondering if you need something special to gain access to the Schedule Chart object. Don’t worry, you don’t, you just need to unhide this visualization if it isn’t already. You can do this from the Objects’ drop down menu. There are several other objects available to you


Hi! My name is Allison, and I recently completed my undergraduate work at UNC-Wilmington. I am currently in grad school at NC State getting my Masters in Social Work (Go Pack!), and am an intern in the Work/Life Center here at SAS. I am assisting Work/Life with aspects of the 2017 College Series
With the advent of things like car GPS & Google Maps, and a steady supply of nice maps from certain news sources (such as the New York Times), people have finally embraced the idea that mapping data can be very useful. And if you are into data visualization, you have