All Posts


Close your eyes and envision opening a bag of popcorn just out the microwave, watching the steam escape and inhaling the unforgettable aroma of delicious, buttery popcorn. Does your mouth immediately start to water? Does your mind wander to childhood memories? Now, where’s the popcorn?!


A classical problem in elementary probability asks for the expected lengths of line segments that result from randomly selecting k points along a segment of unit length. It is both fun and instructive to simulate such problems. This article uses simulation in the SAS/IML language to estimate solutions to the
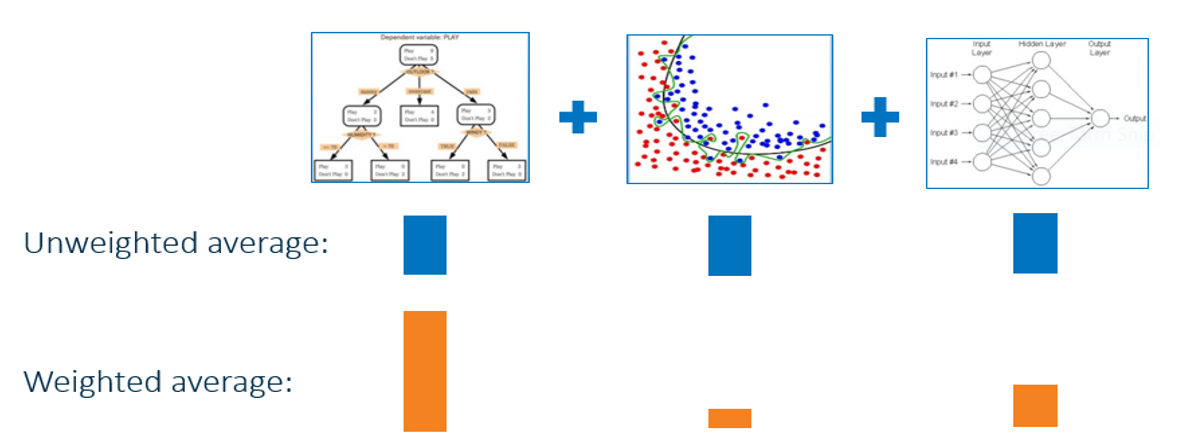

This is the third post in my series of machine learning techniques and best practices. If you missed the earlier posts, read the first one now, or review the whole machine learning best practices series. Data scientists commonly use machine learning algorithms, such as gradient boosting and decision forests, that automatically build


El aumento desmesurado de los datos y la latente necesidad de aprovecharlos para tomar mejores decisiones, ha llevado a que soluciones como las de la analítica no solo estén al servicio del crecimiento de los negocios, sino que tengan un alto impacto en la calidad de vida de las personas


Trivial Pursuit, Justin Bieber and Timbits. Some pretty great things have come from Canada, eh? Well, you can go ahead and add expert SAS programmers to that impressive list. In this video, six Canadian SAS programmers, with more than 115 years of SAS programming experience between them, share some of their favorite, little-known SAS programming tips. You're sure to discover a new trick or

Too much to do and not enough time to do it. That's a common refrain in government, but an important one because of the critical role government plays in the lives of so many. In a new book from SAS, A Practical Guide to Analytics for Governments: Using Big Data
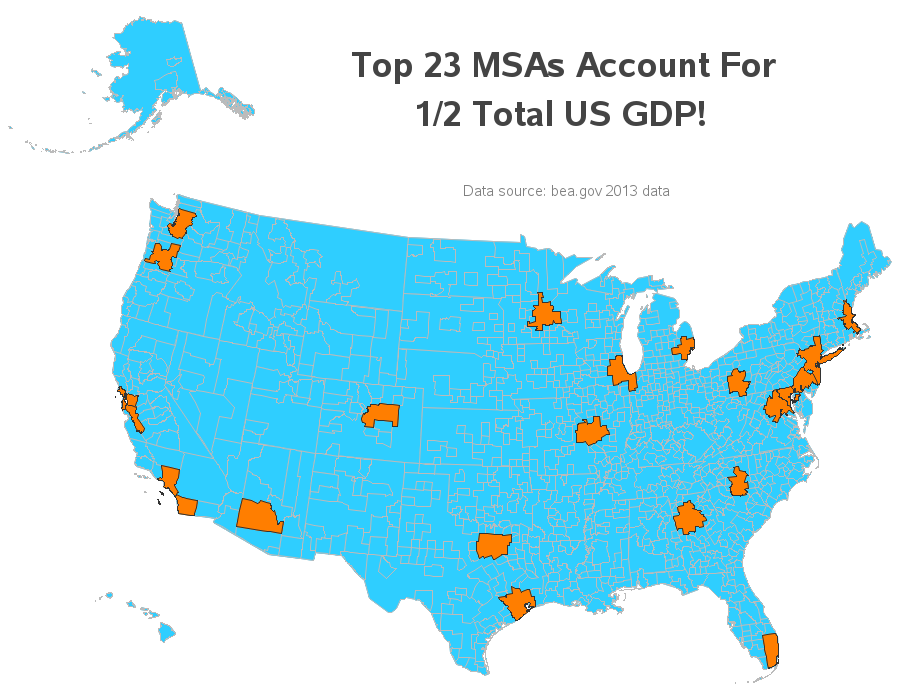

When it comes to economic activity, a handful of the largest metropolitan areas in the US account for lion's share. In 2013, the top 23 Metropolitan Statistical Areas (MSAs) accounted for 50% of the total US Gross Domestic Product (GDP). I recently came across a map created by Alexandr Trubetskoy


디지털 시대의 도래와 함께 수많은 정보와 데이터가 빠르게 생성되면서 사회 다양한 분야에서 빅데이터가 폭넓게 활용되고 있습니다. 기업들도 비즈니스 데이터를 수집, 분석해서 상당한 가치를 얻을 수 있음을 잘 이해하고 있는데요. 하지만 사실 분석 활동이라는 개념은 예전부터 있었습니다. 수십 년 전인 1950년대에도 기업들은 트렌드를 파악하고 인사이트를 얻기 위해 기본적인 분석을 하고 있었습니다.


“Es una apuesta de la compañía”. Con esta frase, muchas empresas de la industria de bienes de consumo (CPG, por sus siglas en inglés) describen su decisión de introducir un nuevo producto al mercado. En el enunciado, la referencia al juego no es gratuita. En este sector, lanzar una novedad,


Jim Harris considers whether we can save private data in the age of big data.


4차 산업혁명은 전 세계 산업 구조는 물론 교육 환경에도 큰 영향을 미치고 있습니다. 지난 몇 년간 빅데이터, 사물인터넷(IoT), 인공지능(AI) 등 산업혁명을 이끄는 기술을 다루기 위해 필수적인 STEM(과학, 기술, 공학, 수학) 분야 교육에 대한 수요과 공급이 증가했는데요. 이처럼 STEM 교육에 대한 관심이 높아지면서 드러난 명암이 있습니다. 전 세계적으로 STEM 분야의 여성 비율은


Beginning a new school year can be hard for little ones. Whether it is being dropped off the first day of preschool, starting kindergarten, going to a new school or getting a new teacher, young children can experience stress. A lot of times this stress presents itself as separation anxiety – not
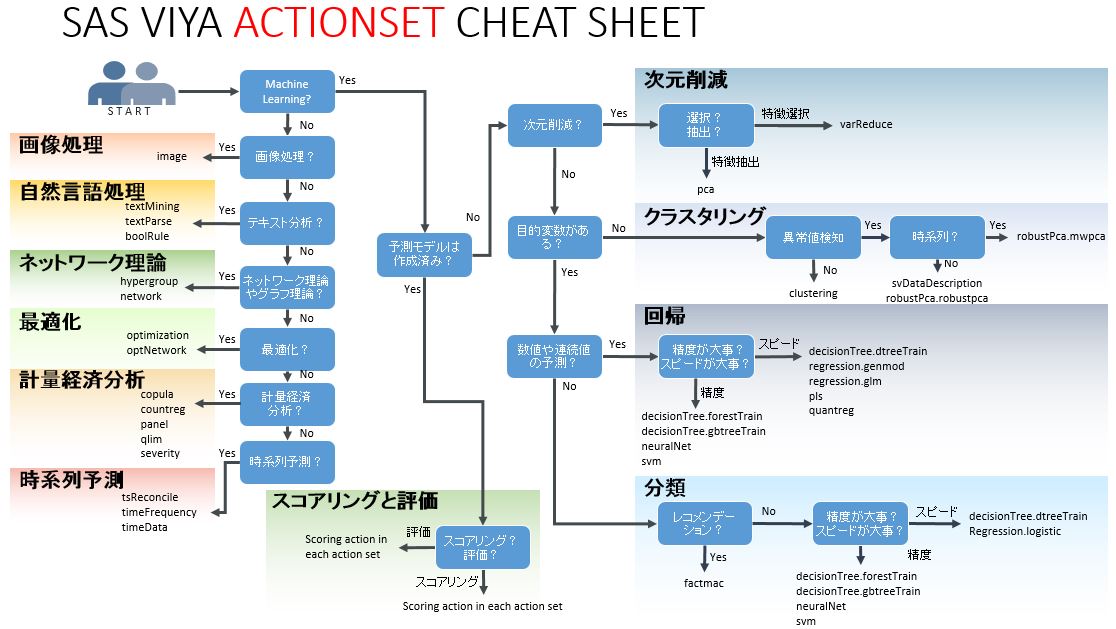

SAS Viyaでは購入前に使い勝手を試していただくため、無償使用版を提供しています。 https://www.sas.com/ja_jp/software/viya.html#preview もう試していただいた方もいらっしゃるかもしれませんが、SAS StudioやJupyter Notebook、Visual AnalyticsからSAS Viyaを操作して、データマイニングや機械学習を便利に試していただくことが可能です。 この無償使用環境では動作確認済みのデモプログラムを提供していますので、機械学習やプログラミングに不慣れでも迷うことはありません。 しかし機械学習を実業務で使い始めようとすると、どのプロシージャやメソッドを使えば良いのか、わからなくなることが多々あります。 SAS Viyaでは機械学習ユーザに不足ないよう、多種多様なプロシージャを提供していますが、プロシージャが増えるとどの場面でどれを使うんだっけ?と迷ってしまいます。 そこで、SAS Viyaのチートシートを作ってみました。 このチートシートを使えば、用途にあわせて必要なプロシージャを選択していくことができます。 SAS Viyaが提供するプロシージャから重要なものを掲載しています。 SAS ViyaはSAS PROCとActionsetという2種類のプログラミング仕様があります。 チートシートもPROC用とActionset用で2種類作りました。 PDF版は以下にありますので、ぜひご参照ください。 viya_cheat_sheet_20170721_jp
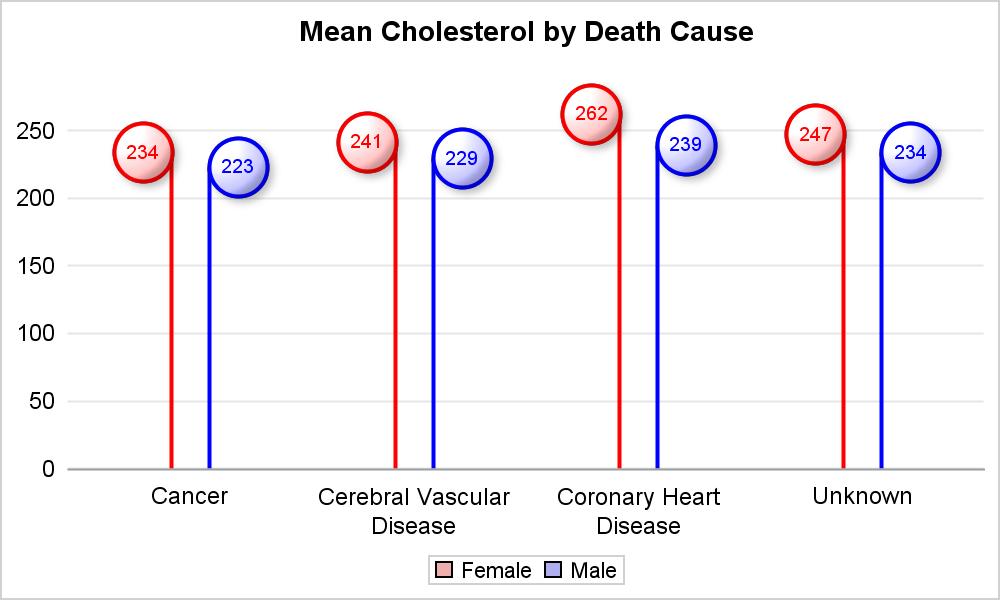

Recently, while reading up on Wilkinson and Cleveland Dot plots, I saw this excellent article by Xan Gregg on the topic. I also saw some interesting examples of Lollipop Charts, kind of a dot plot with statistics along with a drop line, maybe more suitable for sparse data. I thought


In the first half of 2017 and in my only domain – which is marketing – an announcement set the tone for a major change. How not to be stunned when “Coca-Cola ditches global CMO role in leadership shake-up”? If there is only one product you can find anywhere on