All Posts


Veterans transitioning back to civilian life face a number of challenges, many of which involve working in a non-military environment. The Honor Foundation helps Navy SEALs and other current and transitioning members of the U.S. Special Operations community enter civilian life. Last week, a group of former special operators visited several

The Cloud Analytic Server (CAS for short) is SAS’ latest high-performance, scalable, in-memory analytic data server. In this post, I’d like to discuss the CAS physical data model, i.e.what features CAS offers for data storage, and how to use them to maximize performance in CAS (and consequently SAS Visual Analytics
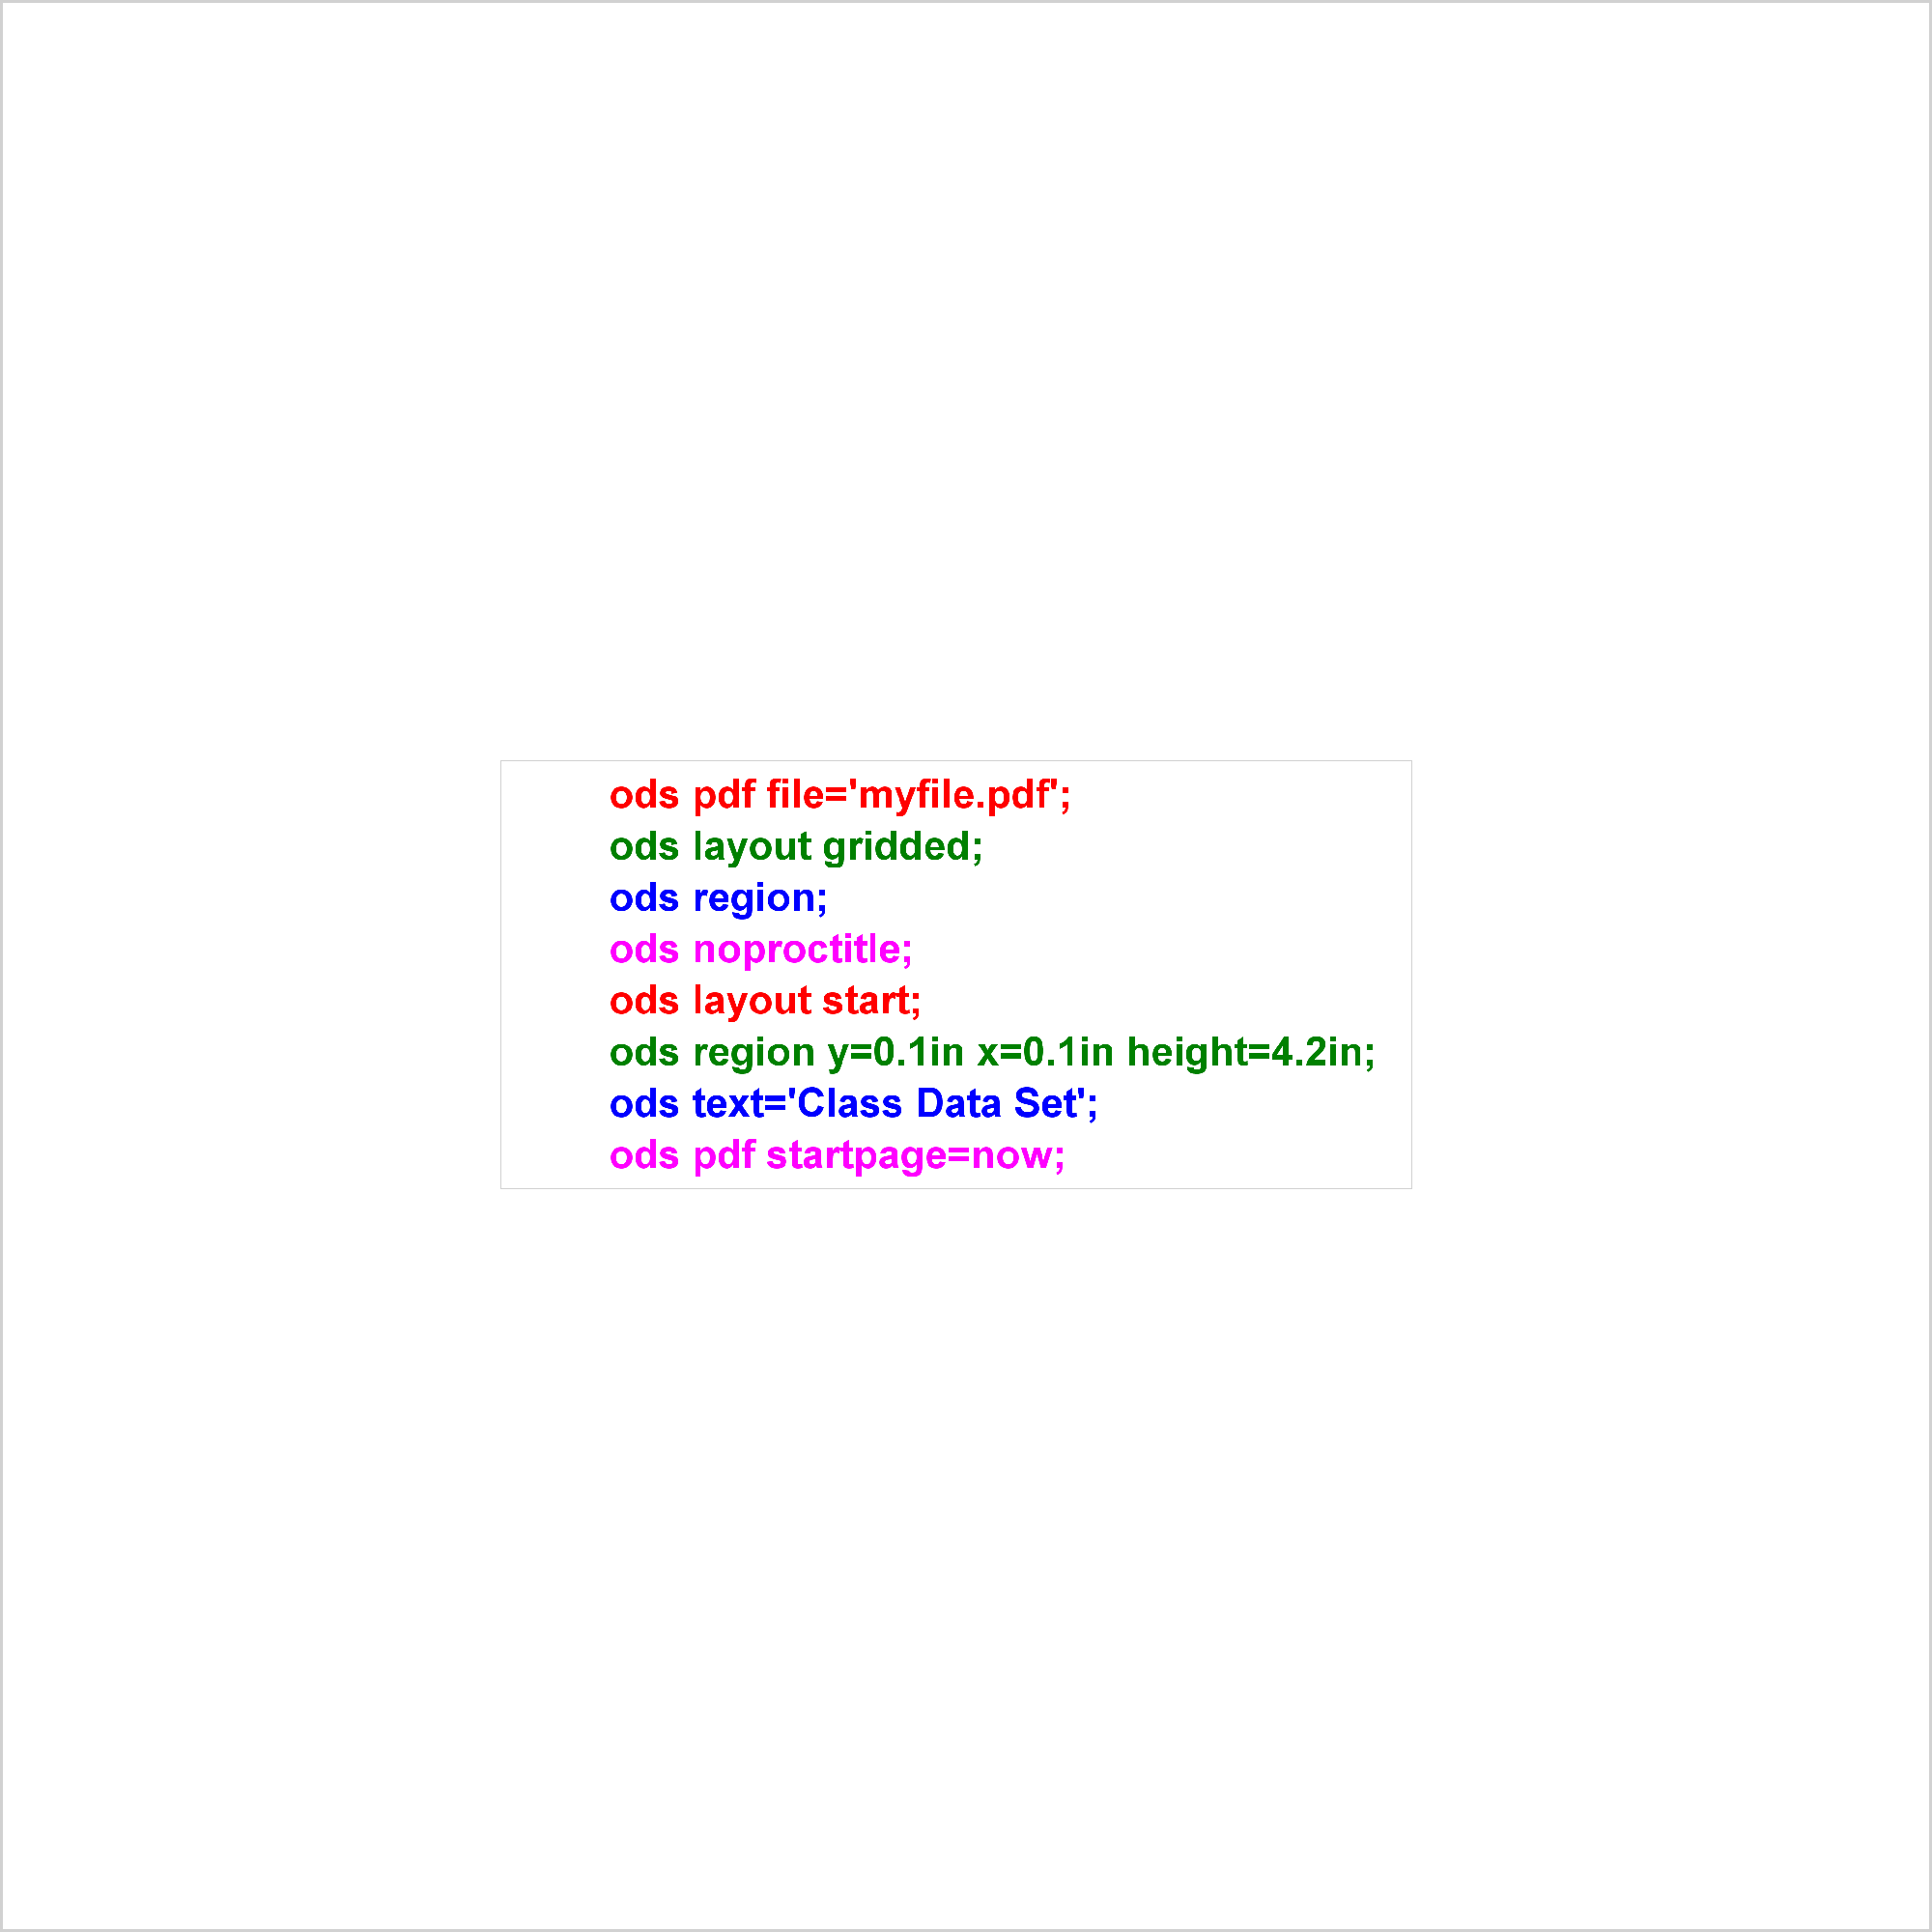

PROC SGPLOT displays titles inside the graph. If you want to display a title inside the graph and a different title outside the graph, you can use the ODS LAYOUT or the GTL. The ODS LAYOUT gives you precise control over your output and enables you to display multiple graphs and tables in each page.
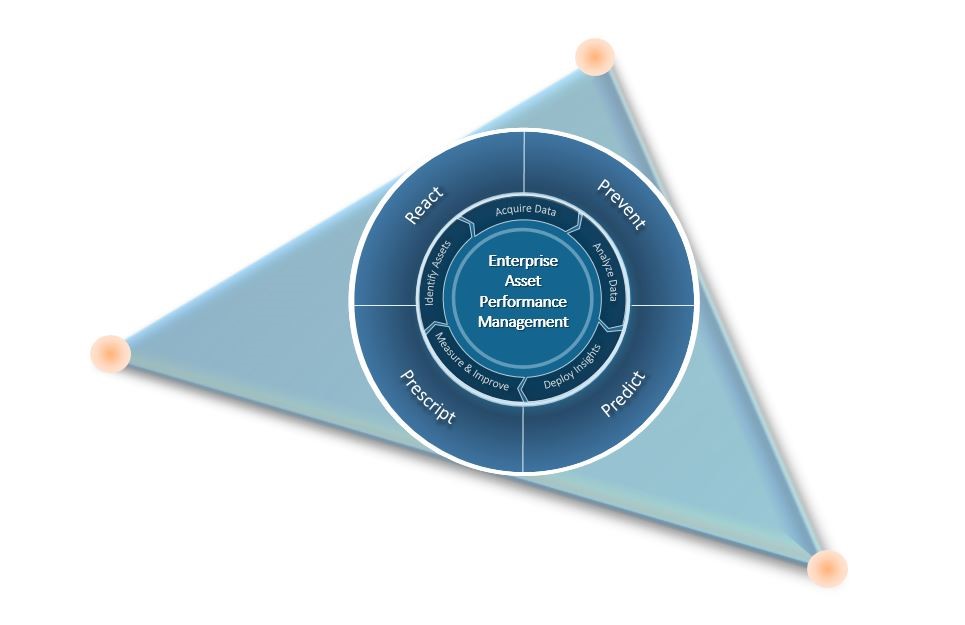

In an increasingly complicated operating environment, the global oil and gas industry struggles to optimize their asset portfolio. Producers combat severe challenges inherent to aging facilities in the context of pricing volatility. Change is the new constant, as the cyclical nature of the oil and gas industry means that producers


Phil Simon shares his thoughts on this simple yet often-overlooked question.
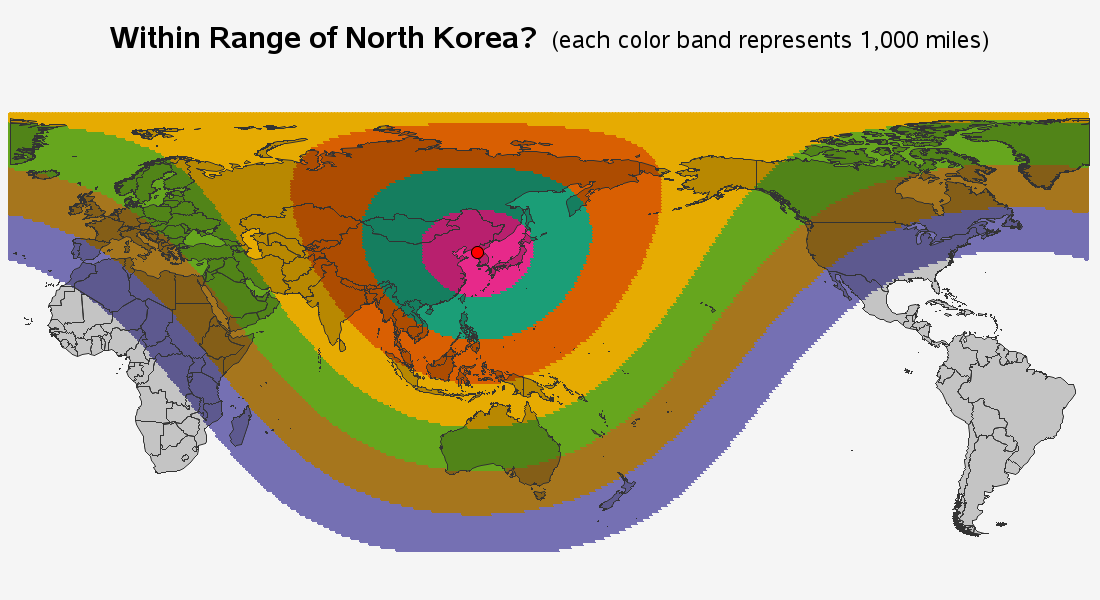

With North Korea's growing missile capabilities in the news lately, I thought it would be interesting to create a map showing how far (or close) they are from other parts of the world. I first did a few searches on the Web, to see what maps are already out there.


When someone refers to the correlation between two variables, they are probably referring to the Pearson correlation, which is the standard statistic that is taught in elementary statistics courses. Elementary courses do not usually mention that there are other measures of correlation. Why would anyone want a different estimate of


Recently, I interviewed three SAS customers to understand firsthand how each is using data visualization and analytics in education. In this education analytics series of blog posts, I’ll take you on a journey to learn how each of these customers are turning their data into insights to be a more
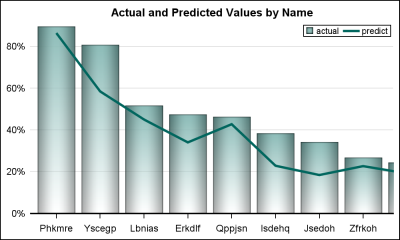

Often we have a graph with many bars (or categories) on the x or y axis. These categories may be sorted by descending response such as frequency of a % value. An example with simulated data is shown below. title 'Actual Values by Name'; proc sgplot data=bars2 noborder; vbar name /


The State of Illinois faces an unprecedented budget crisis, with more than $15 billion in unpaid bills. While experts will argue over the exact causes of states' financial struggles, many are pointing to the problem of state leaders avoiding long-term budgetary problems for short-term fixes. Illinois is not alone in
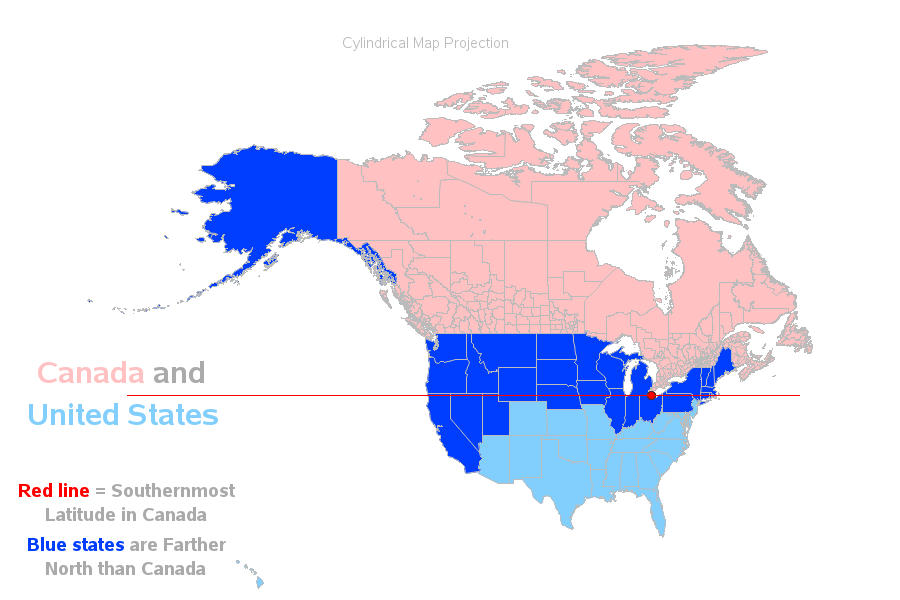
With all the recent talk about some people wanting to move from the US to Canada, I got to wondering how cold, and how far north Canada is. And after a few Google searches, I was surprised to learn that 27 US states are actually farther north than the southernmost point

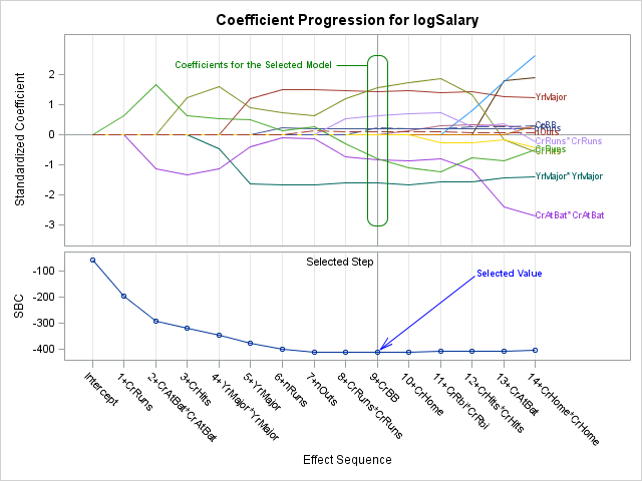
In this post I describe the important tasks of data preparation, exploration and binning.These three steps enable you to know your data well and build accurate predictive models. First you need to clean your data. Cleaning includes eliminating variables which have uneven spread across the target variable. I give an


This is the fifth post in my series of machine learning best practices. Hyperparameters are the algorithm options one "turns and tunes" when building a learning model. Hyperparameters cannot be learned using that algorithm. So, these parameters need to be assigned before training of the model. A lot of manual
SG annotation is a powerful technique for adding text, lines, arrows, shapes, and images to graphs. This post provides a macro that can help you when you make a mistake in writing the annotations.


1980년대 후반에만 해도 머신러닝(machine learning)이나 데이터 과학자와 같은 개념은 없었습니다. 대신 통계, 분석, 데이터 마이닝, 데이터 모델링과 같은 단어가 사용됐는데요. 이후 글로벌 기업들은 30년 이상 머신러닝 모델을 연구해 왔으며, 페이스북의 이미지 인식 소프트웨어, 아마존의 음성 비서 알렉사, KT의 인공지능 서비스 기가 지니(GiGA Genie)까지 그 결과들이 연이어 쏟아지고 있죠! 이러한 결실