All Posts


As traditional reserves deplete and oil prices rise, market analysts predict that the global demand for petroleum products will increasingly be met with oil extracted from non-traditional resources in more challenging and harsher environments. Therefore, companies across the oil & gas industry are evaluating technologies and processes that can deliver

I have a busy life. Did I sign up for it? You bet! Now I’m trying to balance it all and do it well. I’m a mom first and foremost. Being a parent is the most important job someone can take on. Raising the next generation is no easy task
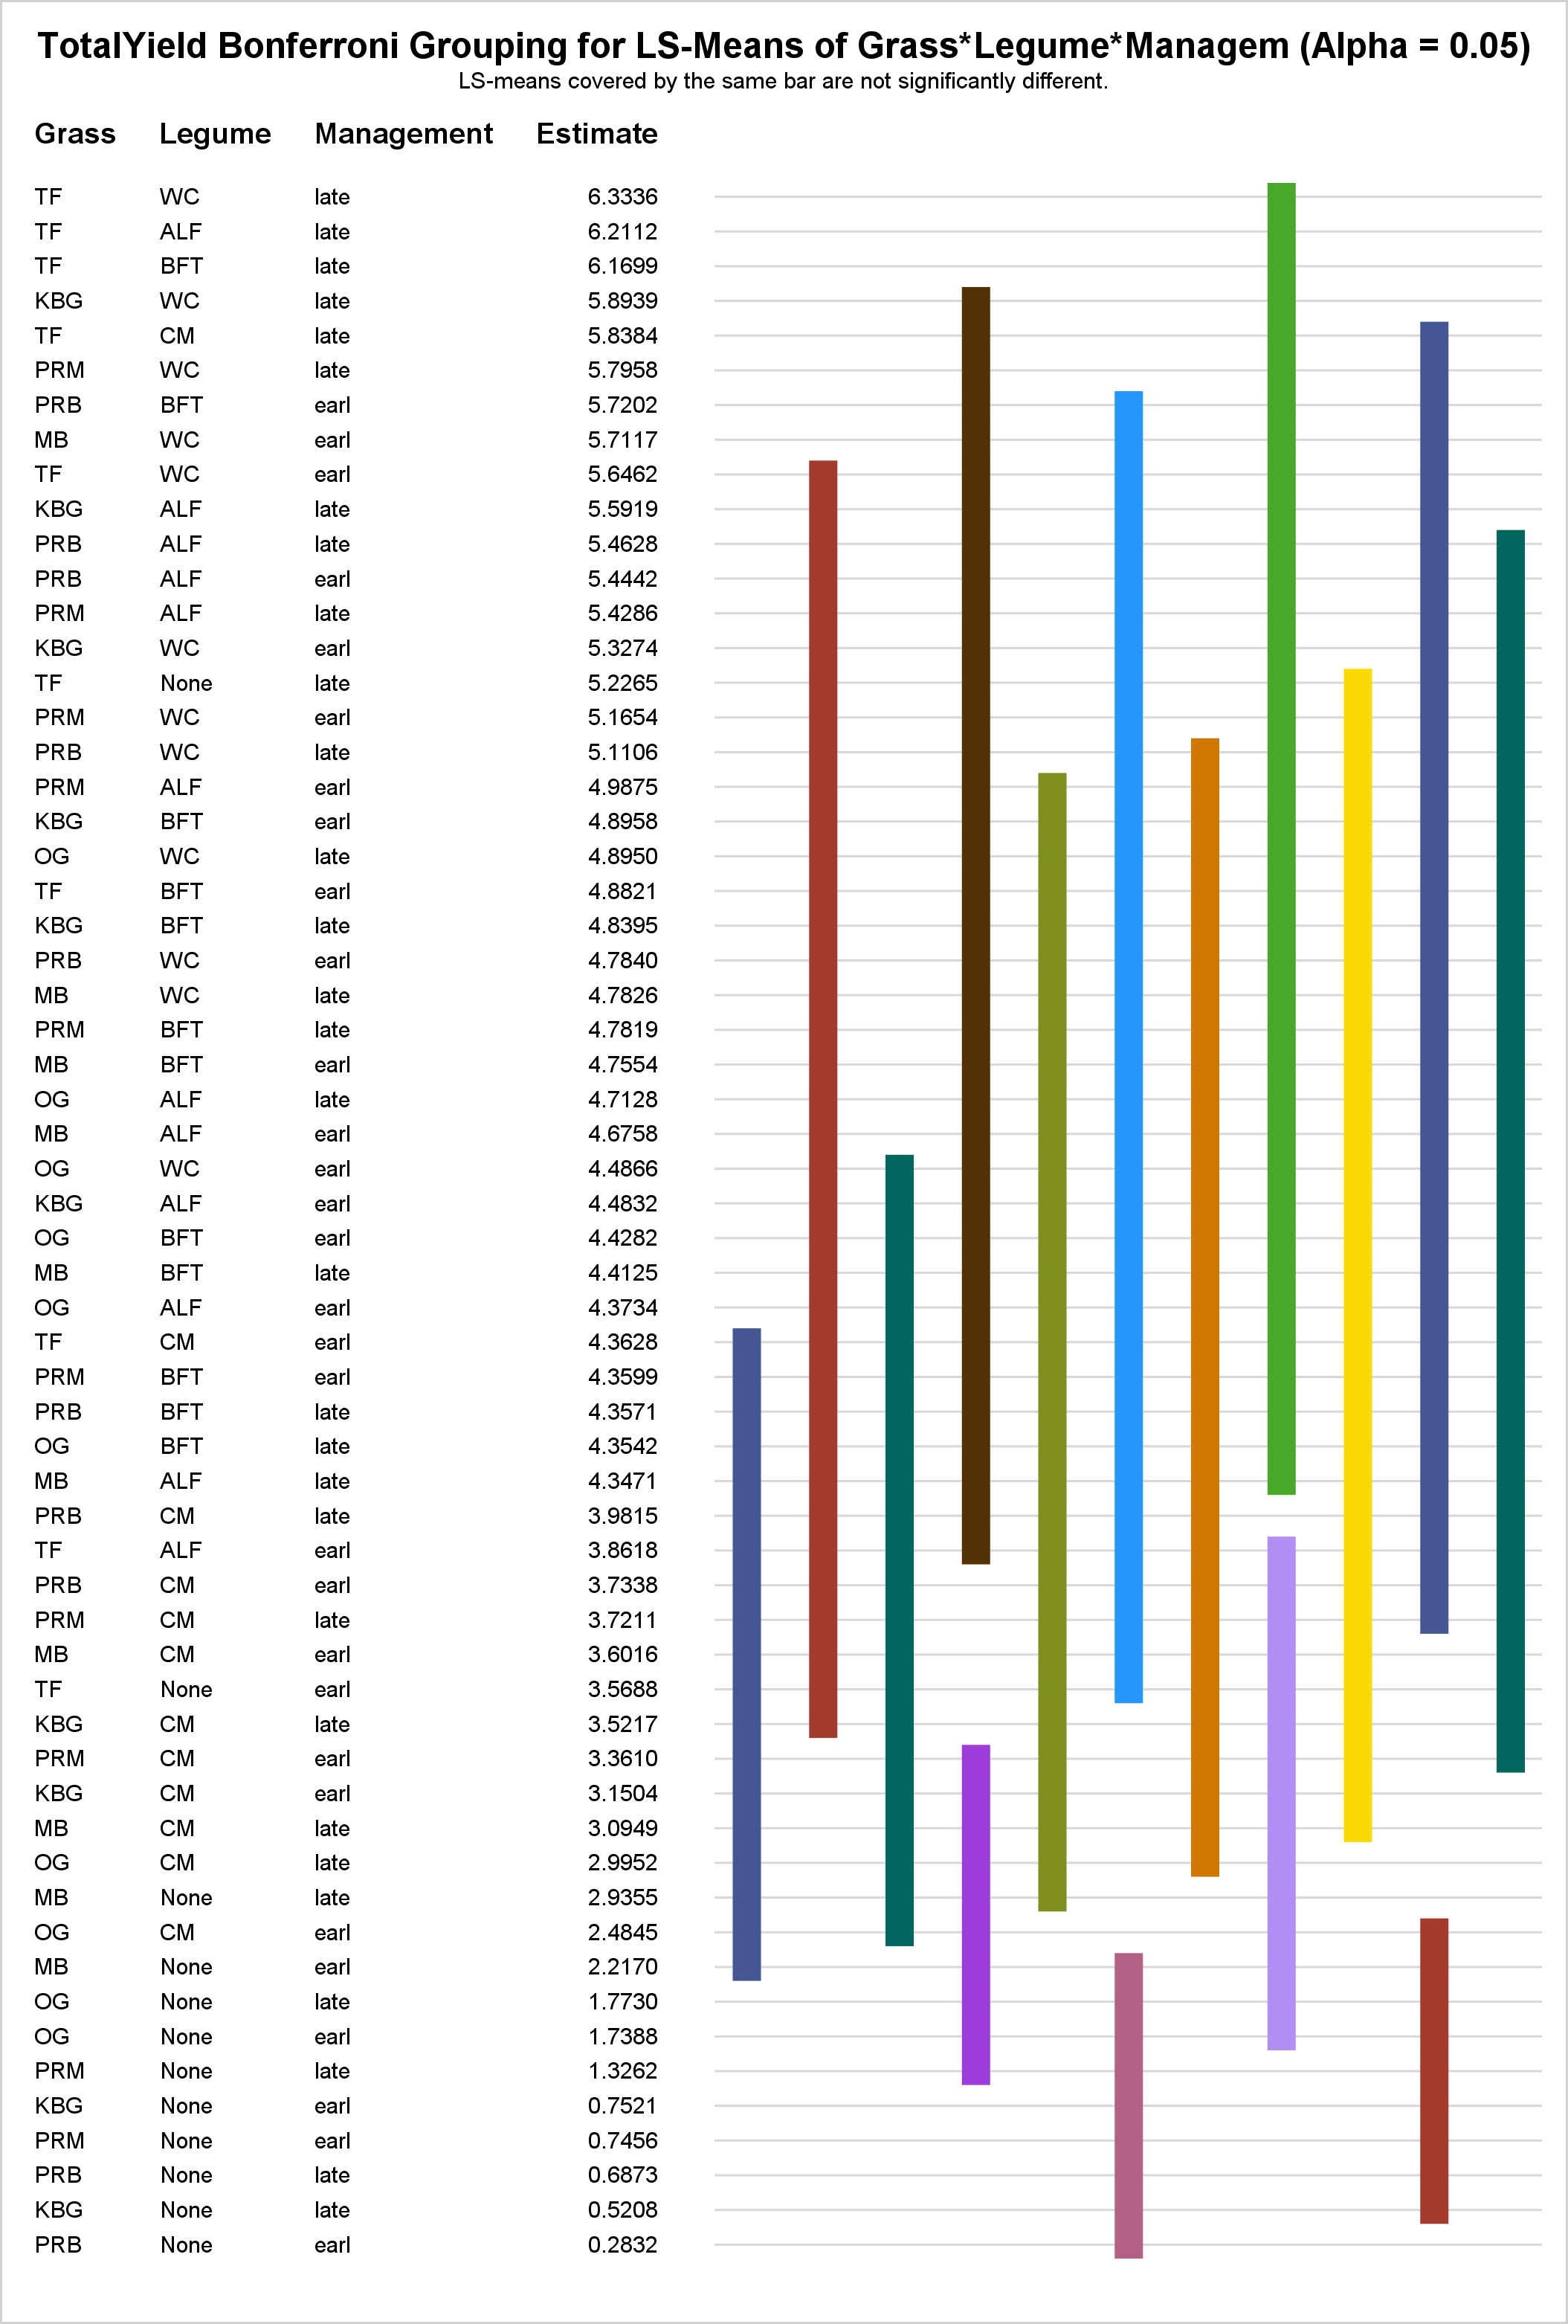

In PROC GLM and most other procedures that compute LS-means, mean comparisons are now displayed graphically. This makes comparisons between a large number of groups easier to interpret.


It's as easy as walking, right? Well, give it a try. October’s move of the month is the “Farmer’s” Carry. It is a SUPER-simple, full body, traveling exercise. It incorporates core stabilization and a familiar daily activity - walking. All you have to do is walk + carry something...preferably
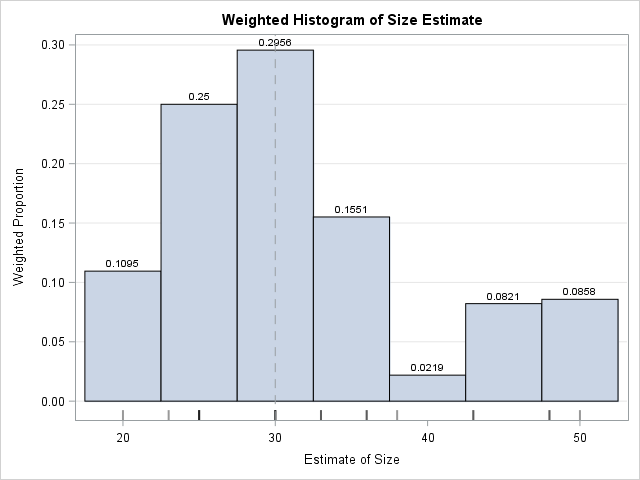

If you perform a weighted statistical analysis, it can be useful to produce a statistical graph that also incorporates the weights. This article shows how to construct and interpret a weighted histogram in SAS. How to construct a weighted histogram Before constructing a weighted histogram, let's review the construction of


‘Quality‘ means many things to many people. It’s subjective and depends on the industry and product being made, but the fundamental objective is to provide the best product to the right standard associated to fit, form and function. And cost and required profit margin must also be taken into account.
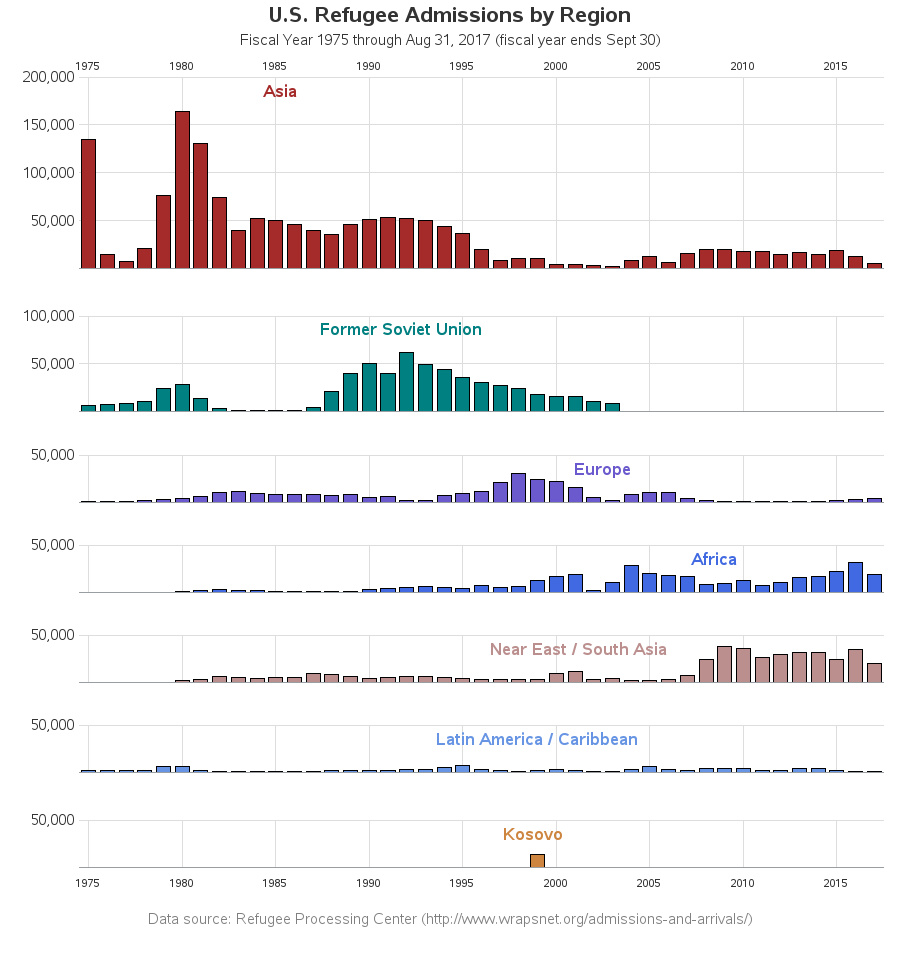

"Coming to America" - it's been the name of a funny movie and a dramatic song (can you name the actor & singer without cheating?!?) It's also been a dream for many, and an action for some. People have been coming to America both legally and illegally for many years, but there's one special category


Los bancos colombianos han entendido que la transformación digital es una prioridad para su industria, sobre todo porque ya no solo están disputándose el mercado con los actores tradicionales sino que han empezado a cruzarse con las Fintech, las diferentes startups que han empezado a ofrecer nuevos servicios financieros basados en tecnología.


La oportunidad de participar en un foro exclusivo para el sector asegurador, lo mismo que el tema principal consideraba las tendencias técnicas relacionadas con la inteligencia del cliente con la facultad de inclusión de las acciones de éstos. Una semana después, mientras que abría una reunión con un cliente que


As smart city endeavors continue to ramp up globally, city planners and leaders are often curious to learn how cities around the world are planning to make their cities smarter with the Internet of Things. Recently, my colleagues and I met with a team from a major city in China


To do their jobs well, Joyce Norris-Montanari says users doing analytical data preparation need access to both standardized and raw data.

Las herramientas convencionales para el desarrollo de estrategias de marketing ya no son los suficientemente capaces de analizar en profundidad y al detalle todos los datos que son generados a diario por los consumidores. Es por esta razón que la analítica avanzada es una de las mejores aliadas para las empresas
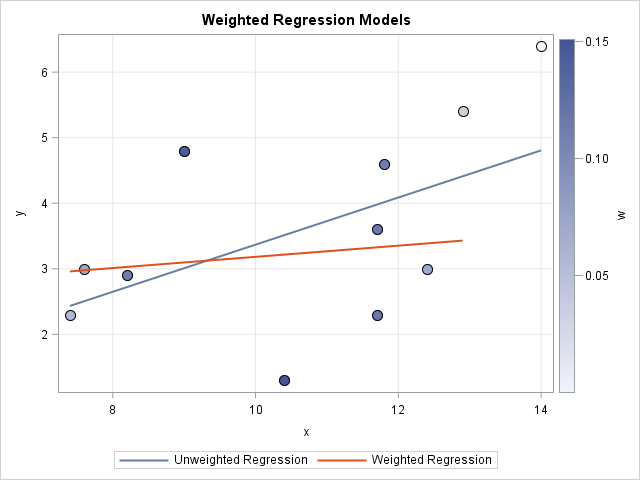
How can you specify weights for a statistical analysis? Hmmm, that's a "weighty" question! Many people on discussion forums ask "What is a weight variable?" and "How do you choose a weight for each observation?" This article gives a brief overview of weight variables in statistics and includes examples of


On a recent visit to an In-House Users Group meeting at a Pharmaceutical company, I presented a 1/2 day seminar on creating Clinical Graphs using SG Procedures. Polling the audience for their experience with these procedures indicated that many SAS users are not familiar with these new ways to create graphs. So,


For our third installment in this blog post series, let’s continue our journey to learn more from three SAS education customers. Today, we'll hear about the benefits their users and institutions have received by using SAS for data visualization and analytics. In this post, you'll hear from: Linda Sullivan, Assistant Vice President