All Posts


산업용 애플리케이션, 기계, 프로세스 등을 연결하는 기술이 발전하면서 사물인터넷(IoT), 더 정확하게는 산업용 사물인터넷(IIoT) 혁신이 가속화되고 있습니다. 산업용 사물인터넷의 가장 큰 이점은 산업, IT, 운영 기술 프로세스를 단일 시스템으로 통합하고, 자동화를 통해 운영 효율성 개선과 비용 절감 효과를 누릴 수 있다는 것입니다. 실제 세계적인 오토바이 제조 업체 할리데이비슨(Harley-Davidson)은 생산 효율성과 민첩성을 목표로

Three bestselling SAS Press authors feature their favorite papers from SAS Global Forum 2018.

Vitamin D (technically, a hormone) plays a role in just about every aspect of our health. It’s not only important for bone health, it also plays a role in blood glucose regulation, heart disease, autoimmune diseases, brain function, thyroid health and even conditions such as ADHD, Autism and depression. Several
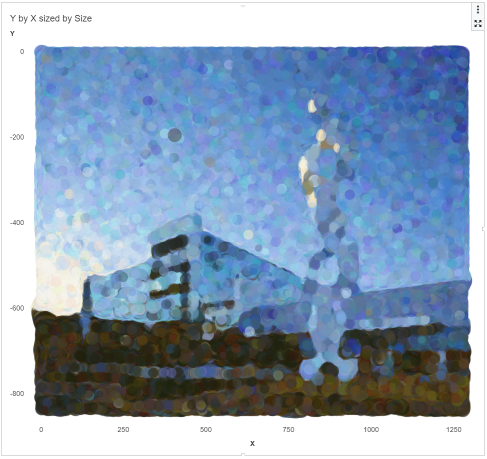

As a fun side project I recently looked into alternative visualization techniques in order to use computers to create art. An interesting approach is pointillism, which, according to Wikipedia is a "technique of painting in which small, distinct dots of color are applied in patterns to form an image." This
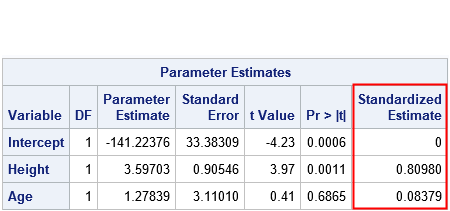

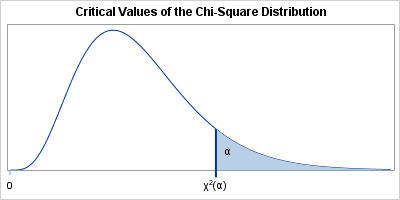
A SAS programmer recently asked how to interpret the "standardized regression coefficients" as computed by the STB option on the MODEL statement in PROC REG and other SAS regression procedures. The SAS documentation for the STB option states, "a standardized regression coefficient is computed by dividing a parameter estimate by

새로운 국제회계기준 IFRS(International Financial Reporting Standards) 17은 보험 업계 역사에 한 획을 긋는 대대적인 변화입니다. 보험 부채의 평가 기준을 원가에서 시가로 변경하는 것을 골자로 보험사의 재무 보고 투명성을 높이기 위한 일련의 새로운 규칙을 명시하는데요. 오래 전부터 이러한 변화를 기다려온 분석가와 여러 이해관계자들에게는 매우 반가운 소식일 것입니다. 실제 IFRS 17은 다양한 국가별


Ya no es ciencia ficción. Prácticamente todos los días interactuamos con ella. La Inteligencia Artificial (IA) vive, literalmente, en nuestros teléfonos inteligentes, en nuestros sitios web favoritos, en el buscador que utilizamos a diario y en los sistemas de información que operan las empresas. Gracias a esta innovación, hoy las


A lo largo de los últimos años, el mundo financiero se ha sometido a los cambios regulatorios impuestos por Basilea II, III y ahora IV, modificaciones que incluyeron la redefinición en la medición de los Activos Ponderados por Riesgo y los requerimientos de capital de calidad, en las que la

El momento tecnológico actual y su acelerada evolución se soportan principalmente en el aprovechamiento de los datos. Sin embargo, si éstos no se procesan de manera oportuna y consistente, las tecnologías exponenciales tales como: la biotecnología, la robótica, la nanotecnología, la neurociencia, el Internet de las Cosas y la Inteligencia


When you hear someone refer to an ‘inside baseball’ move, it means they’re playing into the subtleties of the game. Inside baseball requires a high level of awareness, experience, and strategic thought. This typically results in a mix of strategies to get runners on base and manufacture runs rather than

Did you know that the call for content is now open for SAS Global Forum 2019? Get the details and see why next year's Conference Chair MaryAnne DePesquo is excited about the big event in Dallas, Texas, April 28-May 1, 2019.
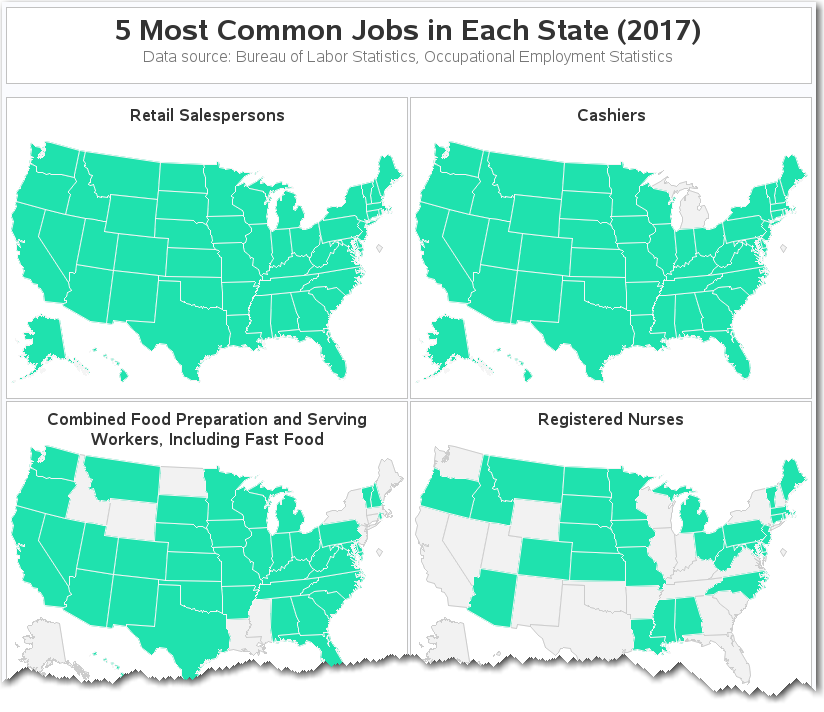

Using small multiples is a neat way to display a lot of information in a small amount of space. But depending on how deeply you want to analyze and scrutinize the data, you need to be careful in choosing just how small you make your small multiples. Let's look at


No matter who you are, or how much you’ve practiced (or how well rehearsed you are) - an interview is stressful! Being on the other side of the table as the recruiter, I wanted to share some tips to help alleviate that stress. It all comes down to preparation. If


I love data; I’m a real and unabashed data geek. I'm the sci-fi nerd who has fun with data from Star Wars and analyzes World of Warcraft logs using SAS. More importantly, I love what data can do. I love the way it can show people new insights and new ideas,
Video killed the radio star.... We can't rewind, we've gone too far. -- The Buggles (1979) "You kids have it easy," my father used to tell me. "When I was a kid, I didn't have all the conveniences you have today." He's right, and I could say the same