In many movies, there is often a scene where the star says "We can do this the easy way, or the hard way" (and the hard way usually involves quite a bit of pain). So it is with interrogations ... and so it is with writing SAS code! Today I'm going to teach you the easy way to calculate cumulative values.
What data will I be using? Here's a photo of my friend Ben (from Ole Time Barbecue) and his daughter, to give you a hint. If you guessed NC State Fair Attendance data, you'd be right!

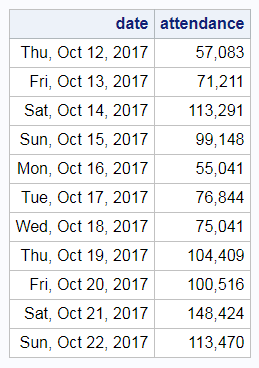
Each year, North Carolina has a state fair in Raleigh (about 4 miles from my house). The fair lasts 11 days, and they post the attendance data on their website each day. Here's the data from this past year (2017), that I have pulled into a SAS dataset:
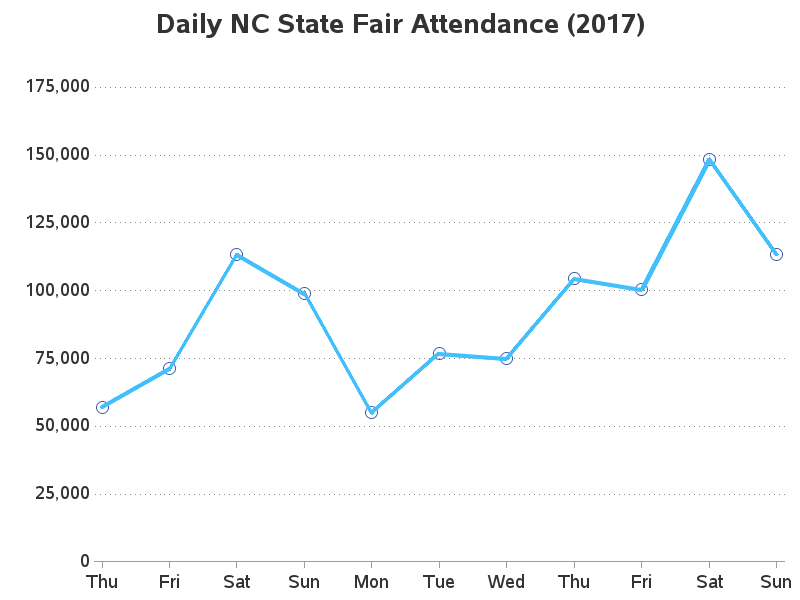
We can easily plot these daily values, and get a graph like the following:
The daily attendance is nice to see, but the cumulative total would also be interesting. You can calculate the cumulative total in SAS using a data step. A data step loops through all the lines of the dataset (one line at a time), and lets you perform actions on the values. By default, you can only perform actions on the values of the current row, but you can use the 'retain' option which allows you to carry a value from one row of data to the next.
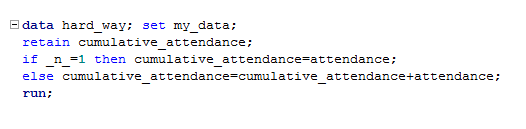
How might you apply it to calculating the cumulative attendance in this data? ... You can use the retain option on a cumulative_attendance variable to keep a cumulative/running total. On the first row of data (_n_=1) you initialize the cumulative_attendance, and then on all other lines you add the current attendance to the cumulative_attendance (which was 'retained' from the previous line). It's a little hard to describe in words, but once you know what's going on the code is fairly easy to follow:
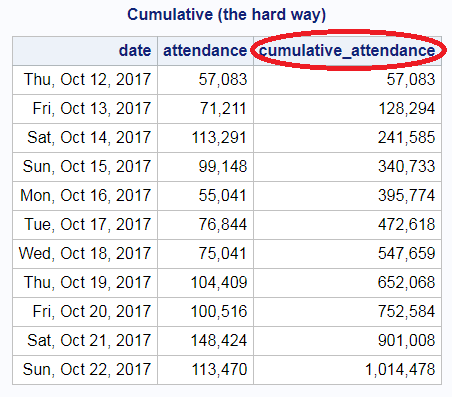
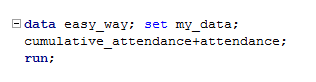
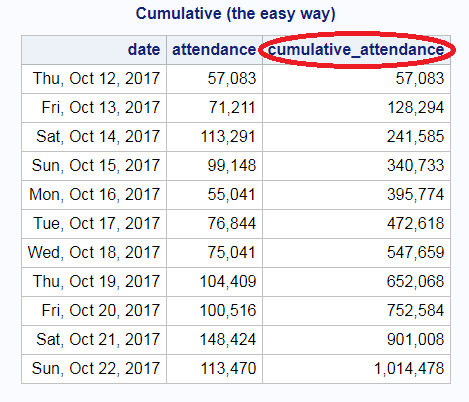
You programmers out there are probably saying "that's not too bad - just three lines of code in a data step..." But that's actually the hard way. There's an easier way to calculate the cumulative total, using only one line of code in the data step! I learned this trick from Dr. David Dickey, while taking his Time Series grad course at NC State University in the 1990s (Thanks Dr. Dickey!) As you can see, the results are exactly the same ... but the code is a lot more concise, which makes it easier to maintain and less prone to human error.
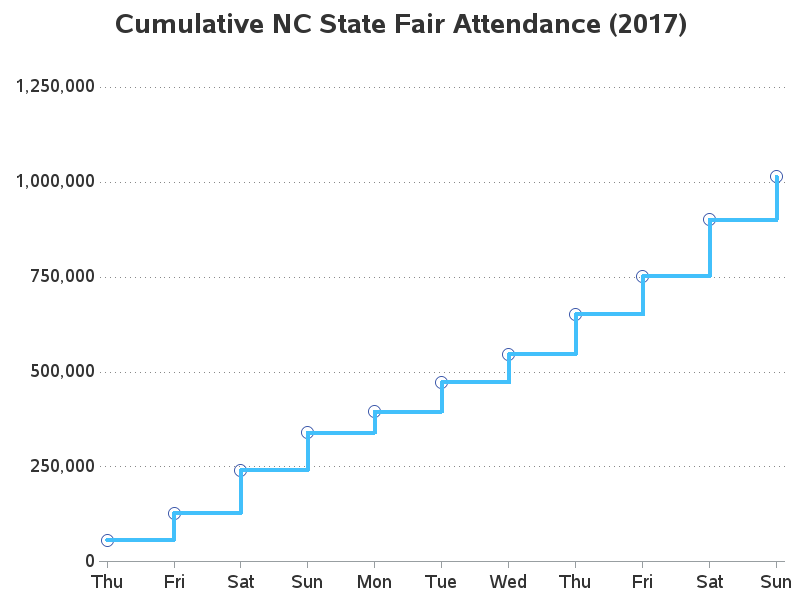
Now that we've got the cumulative attendance for each day, let's plot the data. When plotting cumulative data, I like to use the steplj interpolation (step, from the left, and join the points with a line). Now you can see when the cumulative attendance crossed the 1,000,000 mark in 2017 - it was during the final Sunday.
There are usually about 10 different ways of doing things in SAS - what other techniques have you used to calculate a cumulative total? Here's a link to my SAS code, if you want to use that as your starting place. (feel free to discuss in the comments)

4 Comments
Hi Emily, you should be hearing from Technical Support, if you haven't already, to help sort this out.
I created a cumulative value for my dataset using the code advice suggested above. However, I only want to see the end or total cumulative score not the numbers leading up to it. In this example, I want to see the row which contains 1,014,478. When viewing all of the rows, my dataset is too large so SAS doesn’t respond. Any advice?
Great trick! Worked for me.
Disclaimer: I do not know how to format code in this comment editor, so please accept my apologies for the mess.
I have a strong dislike for SAS's "x+y;" because that one line implicitly does three things:
1) retain x;
2) if _N_ = 1 then x = 0;
3) x = x + y;
I have intentionally kept 1 and 2 distinct in that list, even though "retain x 0;" would perform both activities in one statement. In my experience, I have always found more lines of code that do one thing clearly are much easier to maintain than clever language shortcuts. In my SAS code, retains are frequently combined with by-groups. In that situation, having a "if first.by_variable then do; *initialize all retained variables; end; retain x y z ...;" is my preference.
If you really want short code in your datastep, then you can always outsource to proc fcmp, for example:
data attendance;
call streaminit(-1);
do state = 'MI', 'NC', 'OH';
select (state);
when ('MI')
expectation = 1.1e5;
when ('NC')
expectation = 4.2e5;
otherwise
expectation = 2.5e5;
end;
do year=1998 to 2018;
attendees = rand('POISSON', expectation);
output;
end;
end;
run;
proc fcmp outlib=work.algthms.summation;
function running_total(value /* The value to add to total */, reset /* If reset=1, then set total=value on return. */);
static total;
if reset or missing(total) then
total = value;
else
total = total + value;
return (total);
endsub;
run;
options cmplib=work.algthms;
data cumulatives;
set attendance;
by state;
cumulative_attendees = running_total(attendees, first.state);
run;