All Posts


¿Quién, en ocasiones festivas y/o momentos especiales, no ha escuchado o repetido alguna vez y casi de manera automática: “Brindo por la salud”, “Lo importante es la salud, lo demás va y viene”? Al parecer, son escasos los momentos de nuestra vida, donde nos acordamos de nuestra propia salud, salvo


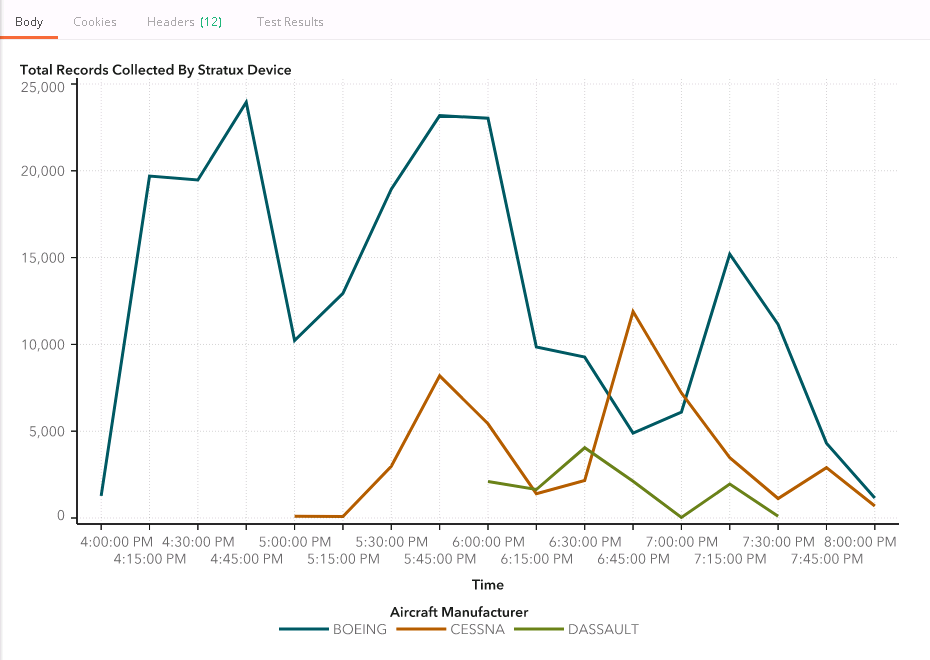
SAS Technical Support has had several requests from customers who want to use SAS® software to help download their files from a website when there is no application programming interface (API) to do it. This post shows how to automate downloads using PROC HTTP and DATA step, and how to use the HTTP DEBUG statement.


I've worked at SAS for over 27 years and have often been asked: What does SAS do? or Why should I choose SAS? It all boils down to one question: Why SAS? While there are many approaches to answering this question, I recently came up with three short, yet powerful,


Innovation is born from curiosity. And at SAS, curiosity is in our values, our DNA, and in our history. Curiosity drove our founders to create SAS, and it all started with a simple question: Is there a better way to analyze data? Year after year, we continued to grow by


Vivimos en un mundo cada vez más digitalizado, donde sacar provecho a los miles o millones de datos que se producen a cada instante se ha convertido en una necesidad para las empresas. Hacerlo de forma ágil y efectiva es su principal objetivo. En este escenario, las soluciones de analítica


We have updated our software for improved interpretability since this post was written. For the latest on this topic, read our new series on model-agnostic interpretability. While some machine learning models – like decision trees – are transparent, the majority of models used today – like deep neural networks, random forests, gradient boosting


Artificial intelligence often seems misunderstood, especially in fraud. The same is true of machine learning. One of the amazing things about them is they ask the unasked questions. This occurs as artificial intelligence (AI) and machine learning (ML) go about their daily work. So, what is the unasked question? Too
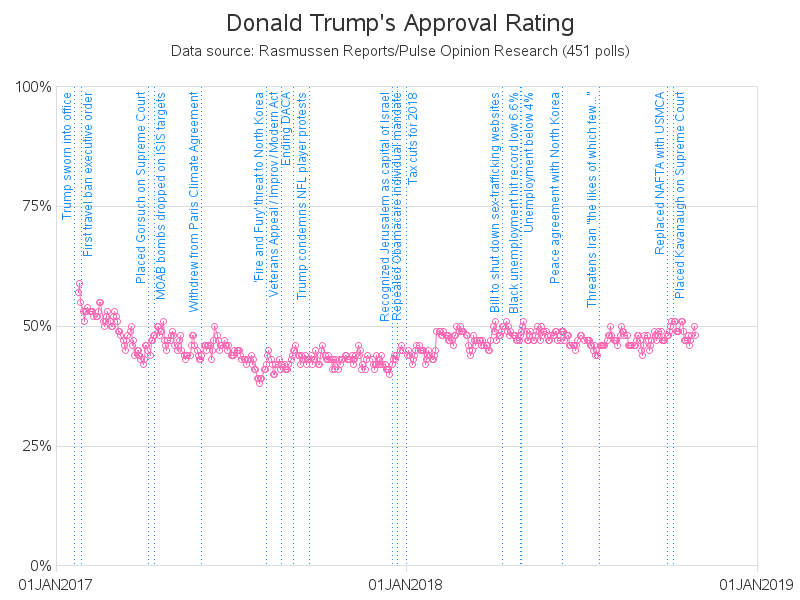

President Donald Trump - people seem to either love him or hate him. Which makes for an interesting data-analysis topic ... tracking Trump's approval rating. Follow along as I explore some data! I'll start with what I consider the 'best' approval-rating graph I've found so far. Here's a screen-capture of


Jim Harris says people still play a pivotal role in data-driven decision making.

This article is the first in a series of three publications covering REST APIs and their use in, and with SAS. Today, I want to cover a basic example using SAS Viya REST APIs to download an image from a report in SAS Visual Analytics.


What skills will students need in order to pursue a lucrative career in analytics? I recently interviewed two professors to find out. In my first post, the professors discussed the importance of teaching and learning analytics. Today, we'll hear their top advice for students studying analytics, such as: get a
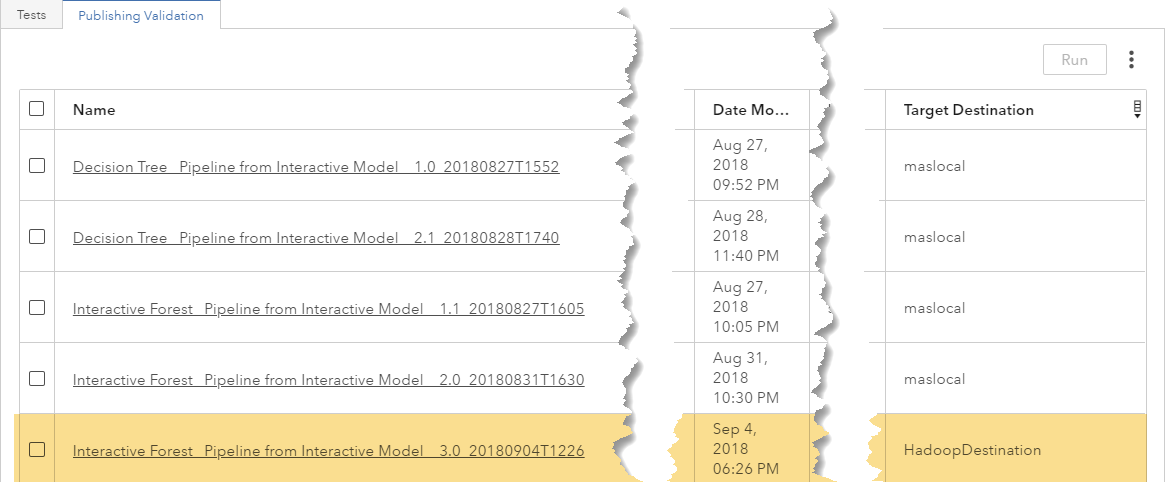

How do you deploy your model so that business processes can make use of it? This post explores how SAS Viya applications can directly add models to a model repository, and specifically focuses on how to deploy them with SAS Model Manager to Hadoop.


I consider October 31, the unofficial start of the holiday season. It begins with Halloween which brings a seemingly unlimited supply of candy. Who needs that many candy corns anyway?! Next is Thanksgiving. A one-day feast that turns into 4 days of binge watching football and eating leftovers. That’s followed
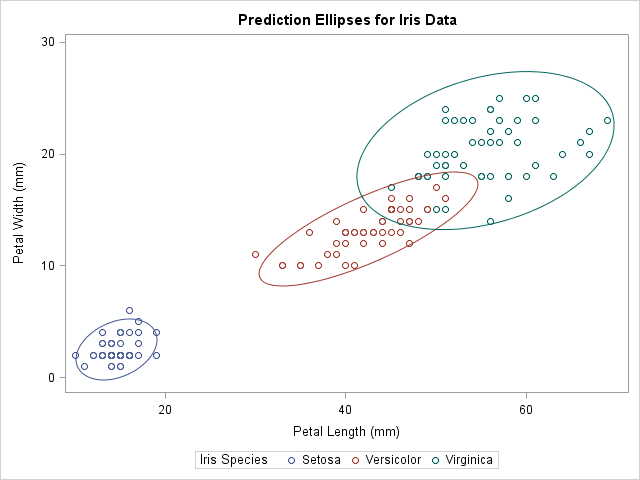

A useful feature in PROC SGPLOT is the ability to easily visualize subgroups of data. Most statements in the SGPLOT procedure support a GROUP= option that enables you to overlay plots of subgroups. When you use the GROUP= option, observations are assigned attributes (colors, line patterns, symbols, ...) that indicate


Note: Today’s utility industry is in upheaval. All of the assumptions the business has run on have been turned on their heads. This post is the second in a three-part series looking at how analytics are helping utilities navigate this challenging landscape and find new opportunities for improvements in operations,