All Posts
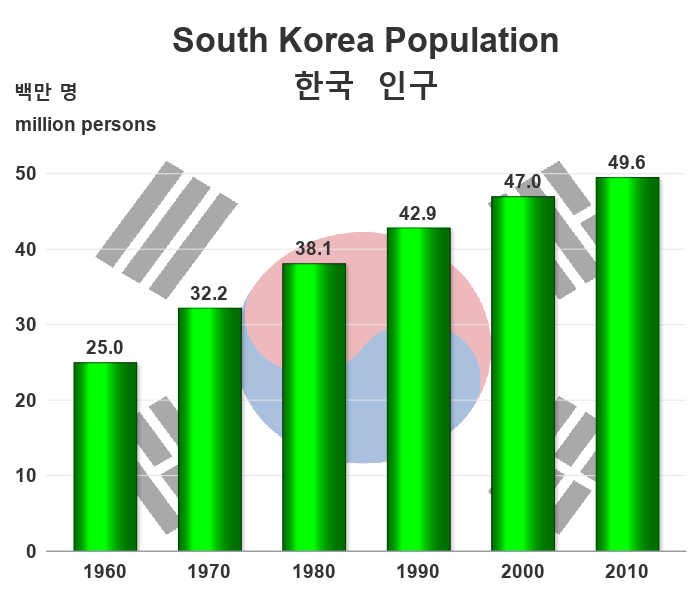

They say "The Sun never sets on the SAS Empire" ... and it's true! There are SAS users all over the world, and SAS output & results could be in any language. Therefore, if you're a SAS programmer, you might need to know how to create SAS graphs with international


SAS supports direct integration for Git from Base SAS (via functions), SAS Enterprise Guide, SAS Studio, and SAS Data Integration Studio. Read this article to learn how to use Git more effectively in your SAS processes.


Guest blogger Khari Villela says data lakes are not a cure-all – they're just one part of a comprehensive, strategic architecture.


Amidst the growing popularity of modern machine learning and deep learning techniques, one of the biggest challenges is the ability to obtain large amounts of training data suitable for your use case. This post discusses how the analytical approach for Named Entity Recognition (NER) can help.


Our dog, Tucker Barktholomew, has this internal clock. Every night at 8pm, he gets up and walks over to my husband and whimpers. It’s his time to go outside in the yard to say farewell to the day and prep for bedtime. He and his sister, Bella Bixby, come in
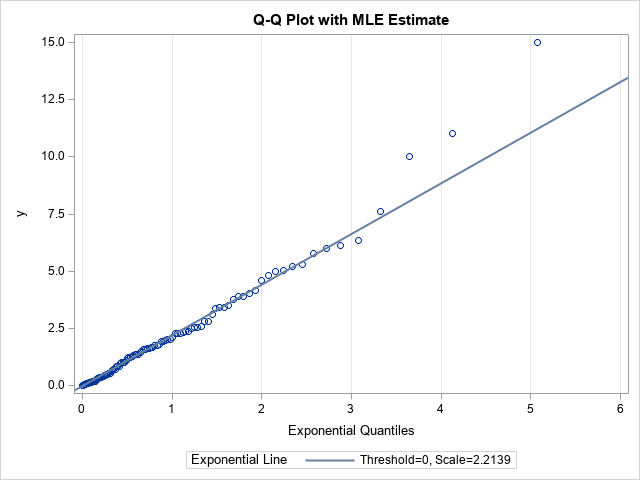

A quantile-quantile plot (Q-Q plot) is a graphical tool that compares a data distribution and a specified probability distribution. If the points in a Q-Q plot appear to fall on a straight line, that is evidence that the data can be approximately modeled by the target distribution. Although it is


The potential for artificial intelligence (AI) and the Internet of Things (IoT) to transform the way health care and therapies are delivered is tremendous. It’s not surprising that the health care and life sciences industries are being flooded with information about how these new technologies will change everything. While it’s
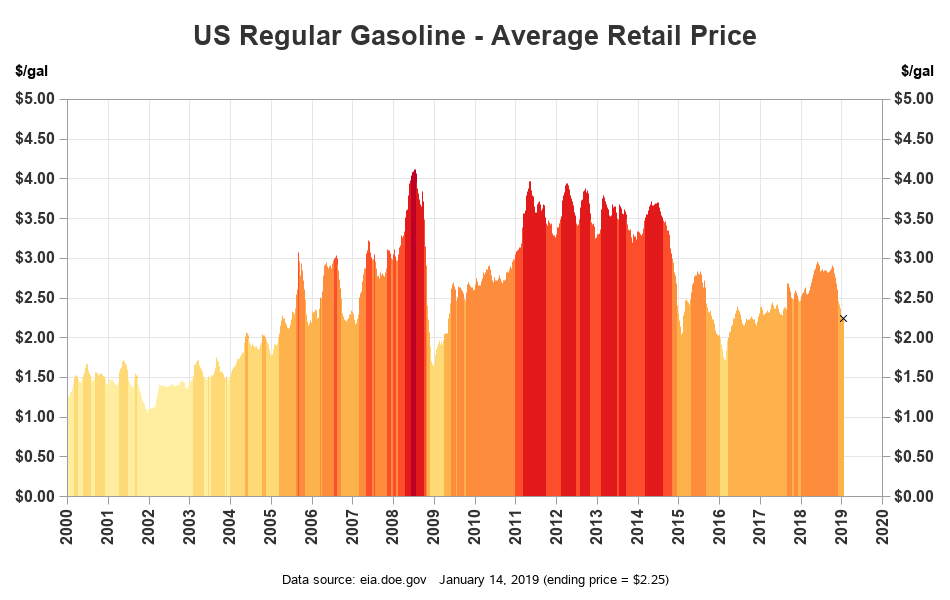
When I fill up my daily-driver Prius, the price of gasoline isn't that important. But when I occasionally take a trip in my V8 Suburban, I pay a lot more attention! Therefore I was pleasantly surprised when I noticed that gasoline prices have been falling. How much have they fallen,

Now is your chance to learn even more about SAS hash tables with four additional articles on the subject.


This Is the latest installment in my series of posts dedicated to describing IoT applications in retail. Why do I want retailers to move more quickly in their widescale adoption of IoT in the coming year? Because I'm confident they'll see results, and these use cases help explain how. As


In the second of three posts on using automated analysis with SAS Visual Analytics, we used the automated analysis object to get a better understanding of our variable of interest, X-Sell and Up-sell Flag, and how it is influenced by other variables in our dataset. In this third and final


A social worker at a software company. On the surface, the two don’t seem to go together. Why would a social worker work for a software company? But asking that question forces us to evaluate other roles that contribute to the SAS experience: Why would an artist choose to bring

When you overlay two series in PROC SGPLOT, you can either plot both series on the same axis or you can assign one series to the main axis (Y) and another to a secondary axis (Y2). If you use the Y and Y2 axes, they are scaled independently by default,


AI seems to be mentioned everywhere these days. But how can AI be used in day-to-day work? Here, Katherine Taylor explains an example of "practical AI" in banking using SAS Visual Data Mining and Machine Learning. She'll explore more business problems and industries in future posts.


Does this situation sound familiar? You have a complex analysis that must be finished urgently. The data was delivered late and its quality and structure are far from the expected standard. The time pressure to present the results is huge, and your SAS program is not giving you the expected