All Posts

SAS has worked with our exam delivery partners to integrate a live lab into an exam, which can be delivered anywhere, anytime, on-demand.


With or without food? Morning, midday or evening? How should I take my supplements? How and when you take supplements is just as important as which supplements you take. The timing and quality of supplements determine how many nutrients your body is actually able to absorb and use.
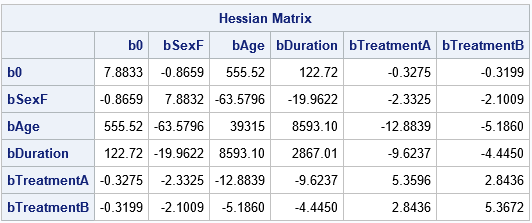

When you use maximum likelihood estimation (MLE) to find the parameter estimates in a generalized linear regression model, the Hessian matrix at the optimal solution is very important. The Hessian matrix indicates the local shape of the log-likelihood surface near the optimal value. You can use the Hessian to estimate


This Is the third and final installment of a series of posts discussing promising use cases in retail and the benefits of adopting IoT technologies in 2019. What will be the ground-breaking new application of IoT and analytics that drives an epiphany and spurs widespread adoption? In previous posts, I discussed


Multi-tenancy is one of the exciting new capabilities of SAS Viya. Because it is so new, there is quite a lot of misinformation going around about it. I would like to offer you five key things to know about multi-tenancy before implementing a project using this new paradigm. All tenants

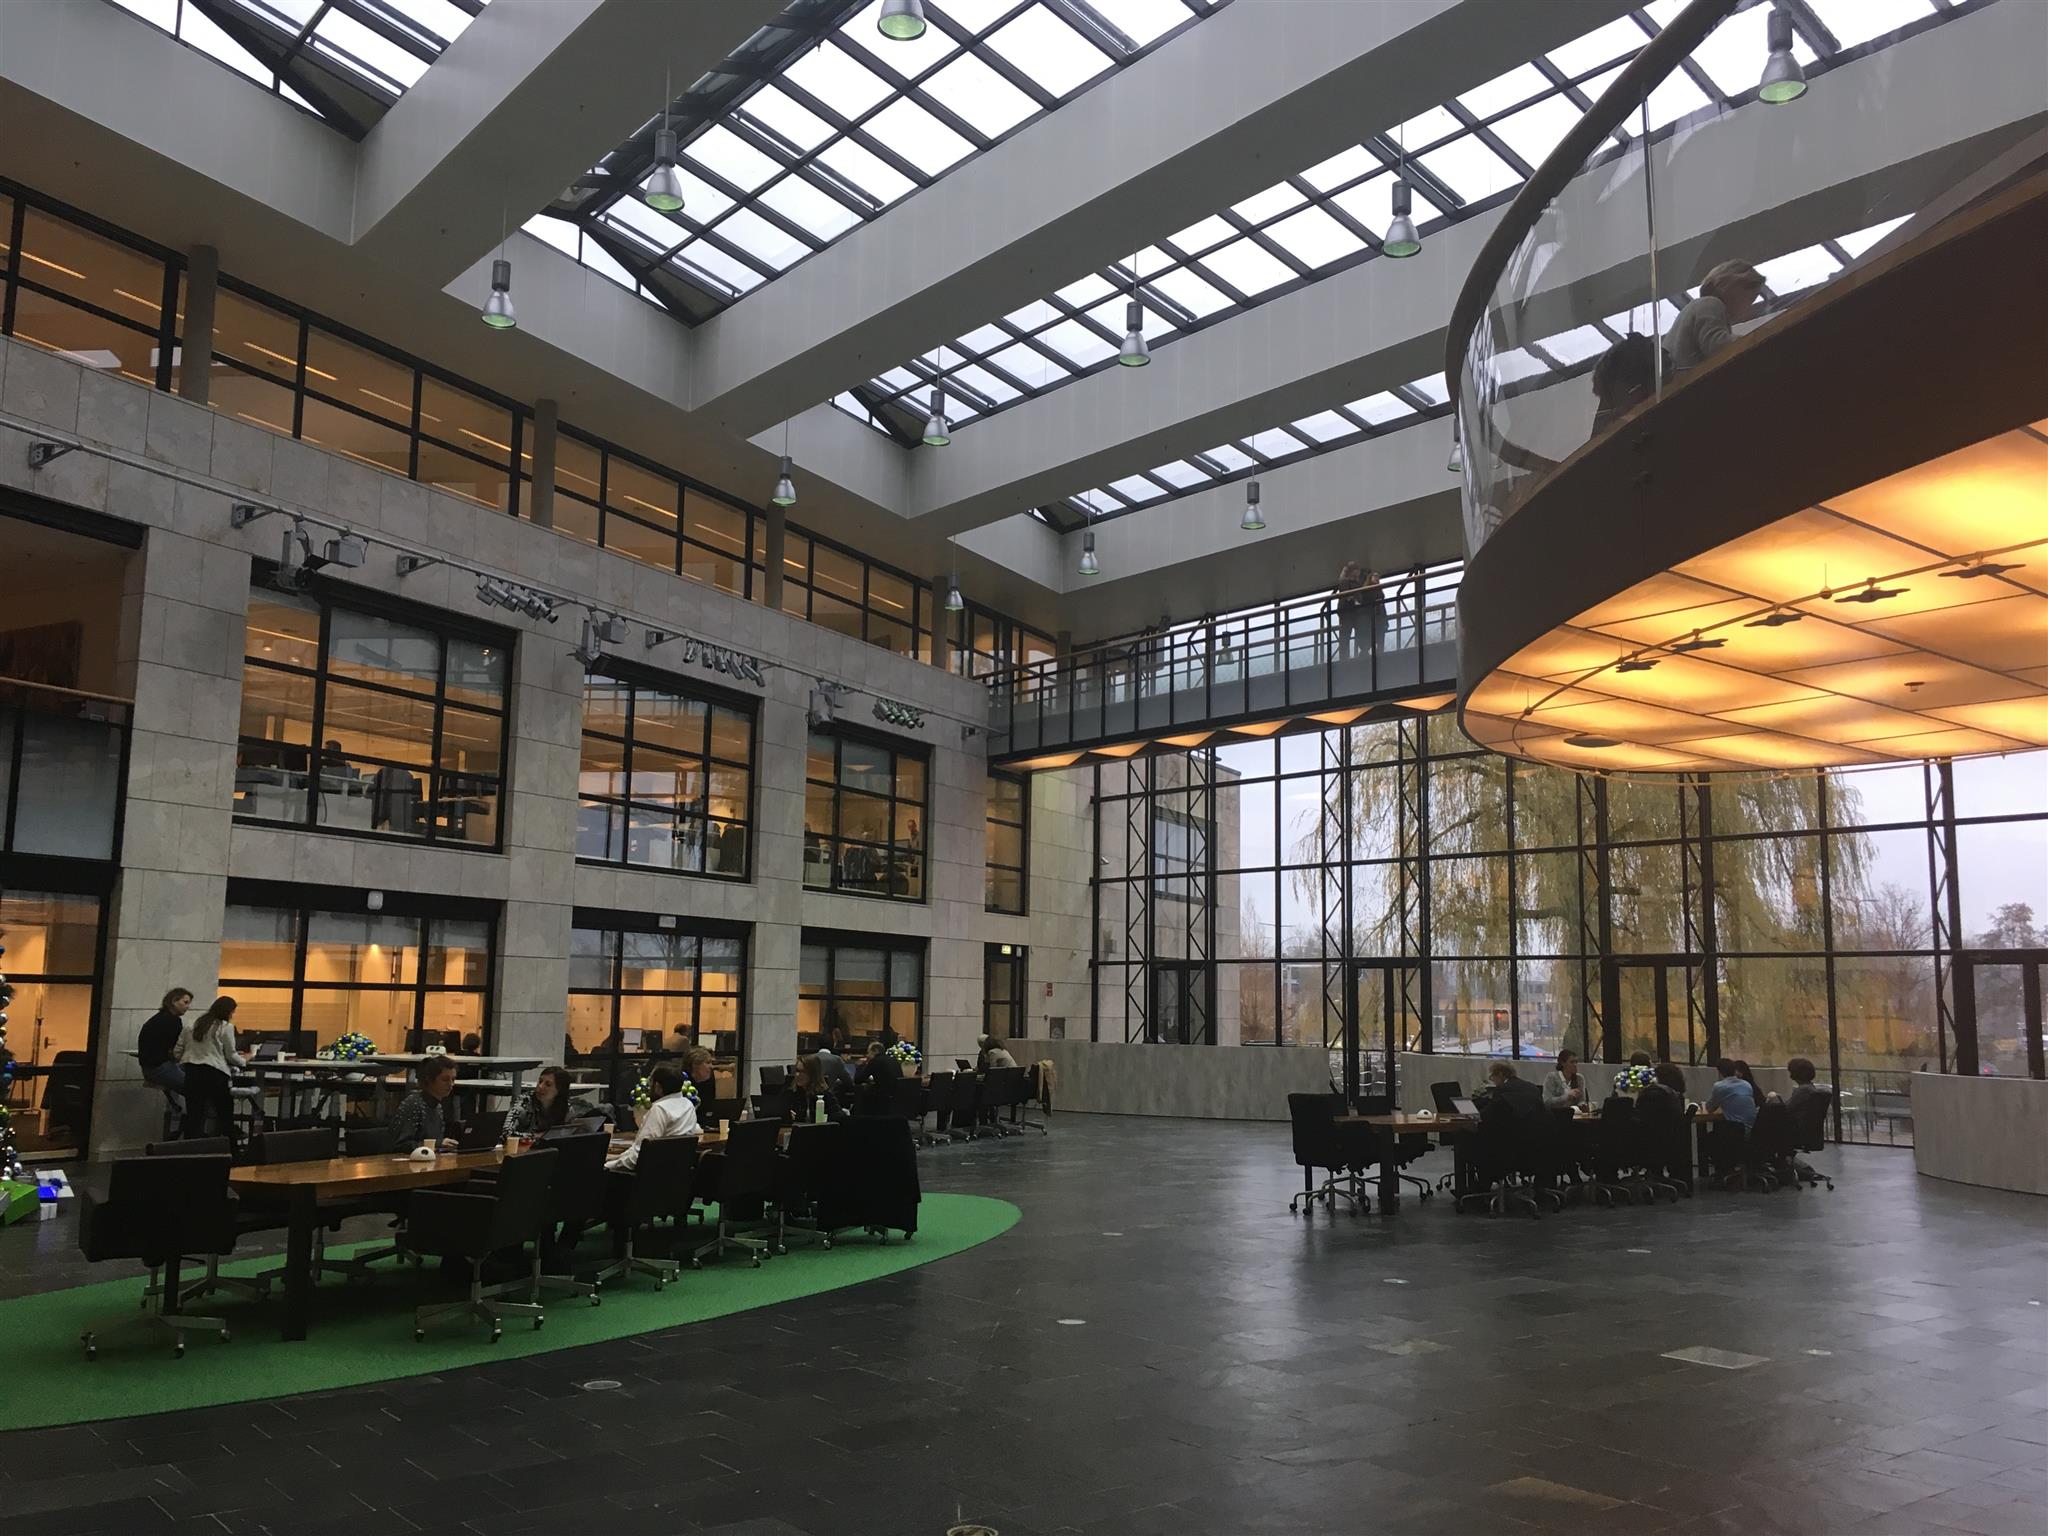

This episode covers one of the greatest challenges in Dutch data science: how to distribute €43 billion (no, that’s not a typo) among all Dutch health care insurers in a fair, equal and transparent way. To learn more, I visited the biggest health insurer of the country, Zilveren Kruis, and


During each minute you spend reading this article, 18 people will die of cancer. With each tick of the clock, your odds of becoming one of them increases: age is one of the primary risk factors for cancer. Take Nancy. She is a normal, active, healthy woman. Inside her body

As one of SAS' newest systems engineers, recently joining the Americas Artificial Intelligence Team, I’m incredibly excited to gain expertise in artificial intelligence and machine learning. I also look forward to applying my knowledge to enable others to leverage the advanced technologies that SAS offers. However, as a recent graduate


En las semanas recientes, el gobierno mexicano se ha enfocado en combatir el robo de combustible que aqueja a varios estados del país, el delito que se ha producido para Pemex por $3,000 millones de dólares (mdd), según la calificadora de inversiones Moody's Investor Services. Si bien se ha cuestionado


Expect to lose time if you don't include a data steward in your project until you're reviewing the data model.
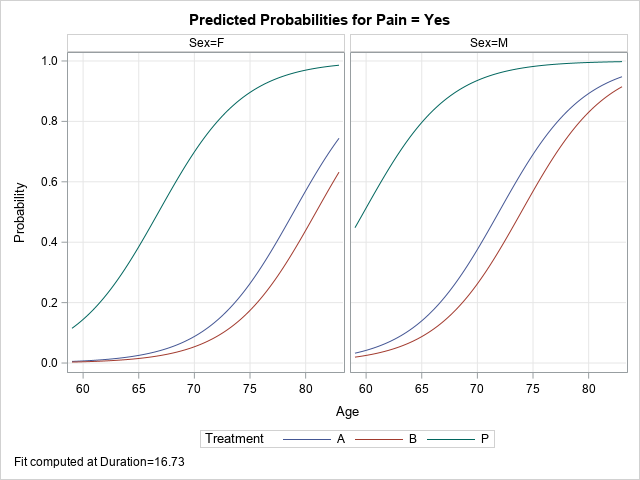
Have you ever run a regression model in SAS but later realize that you forgot to specify an important option or run some statistical test? Or maybe you intended to generate a graph that visualizes the model, but you forgot? Years ago, your only option was to modify your program
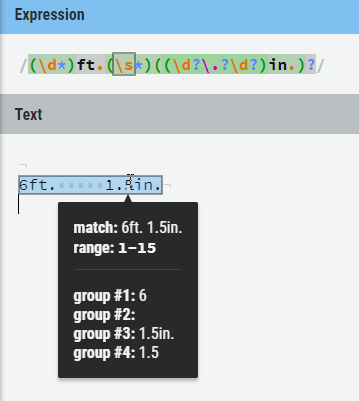

Regular expressions are a powerful method for finding specific patterns in text. The syntax of regular expressions is intimidating, but once you've solved a few pattern-recognition problems with regex, you'll never go back to your old methods.
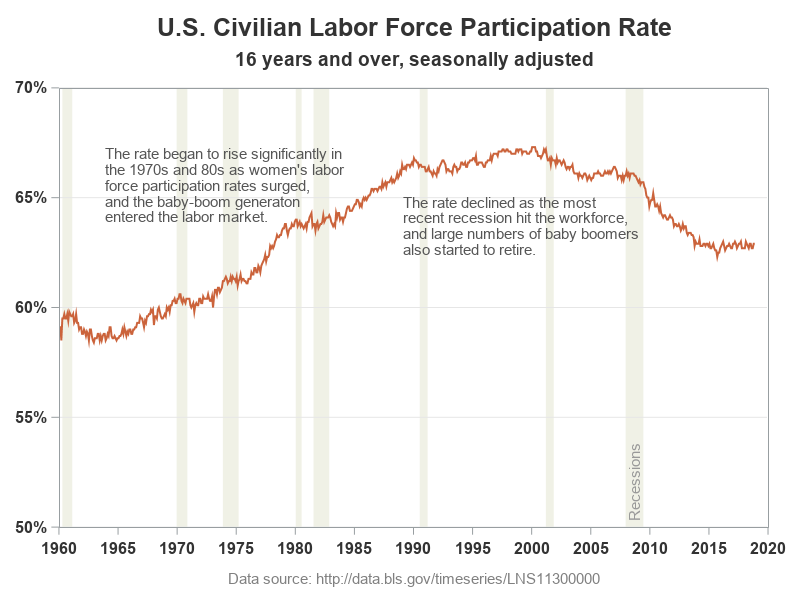

Plotting just your data often helps you gain insight into how it has changed over time. But what if you want to know why it changed? Although correlation does not always imply causation, it is often useful to graph multiple things together, that might logically be related. For example, recessions
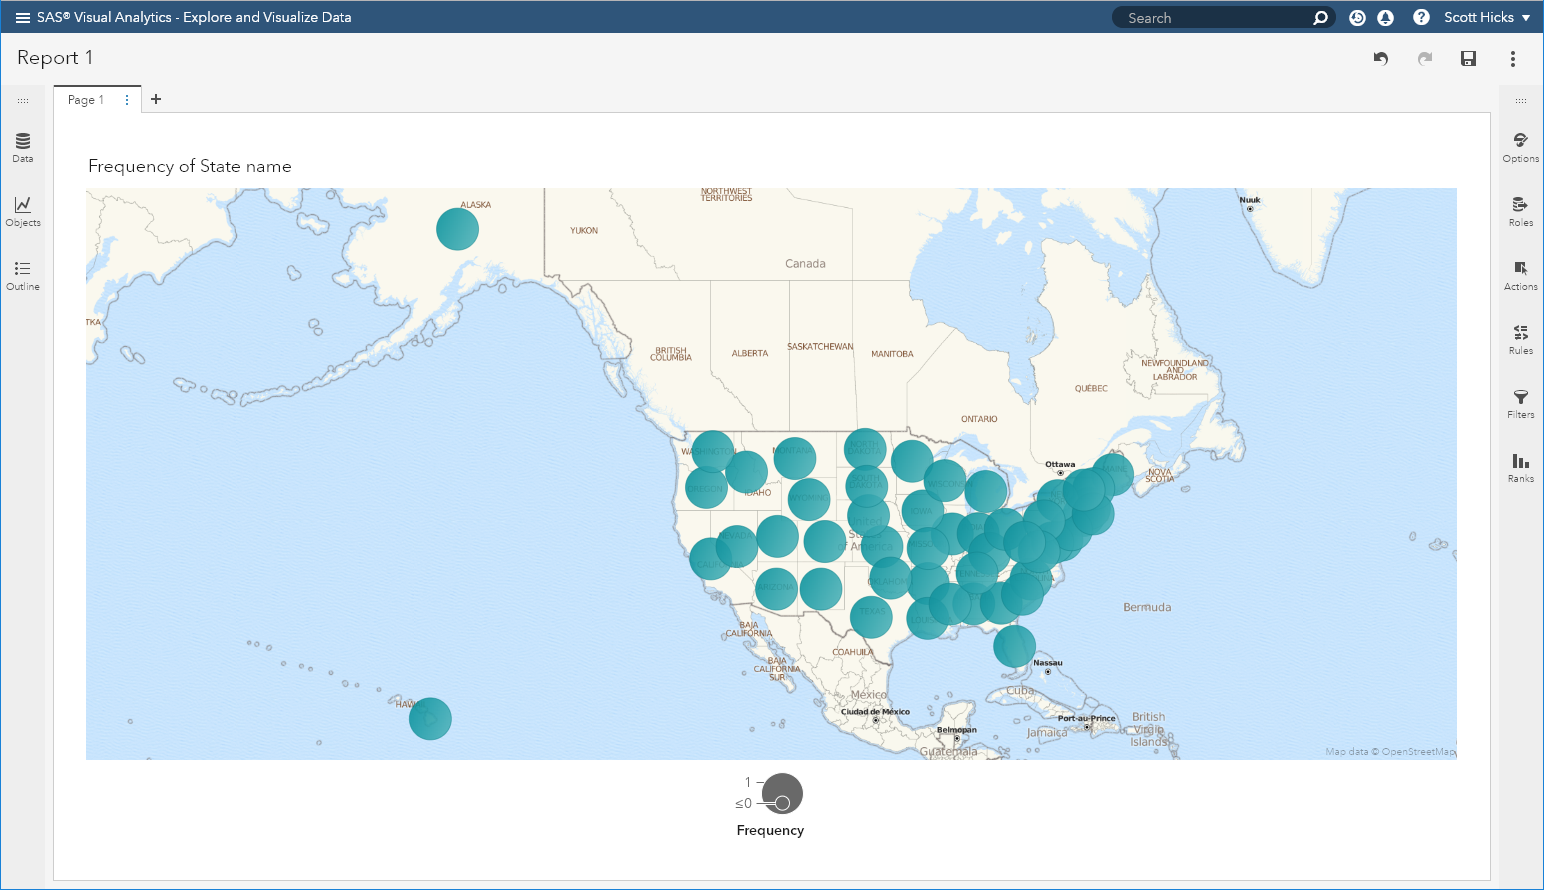

Creating a map with SAS Visual Analytics begins with the geographic variable. This blog post explains the first type of geography variable that VA supports: predefined. Future posts will cover the other two types of geography variables in VA: custom coordinates and custom polygons.