All Posts

In my previous blog post, I talked about using PROC CAS to accomplish various data preparation tasks. Since then, my colleague Todd Braswell and I worked through some interesting challenges implementing an Extract, Transform, Load (ETL) process that continuously updates data in CAS. (Todd is really the brains behind getting


When news about a new Coronavirus outbreak in China first hit the news, Falko and his colleague Anand Chitale wanted to know more. “We knew we could use SAS to analyze the data and discover new insights,” he said. By now, you’ve heard about our work helping customers combat the coronavirus pandemic.
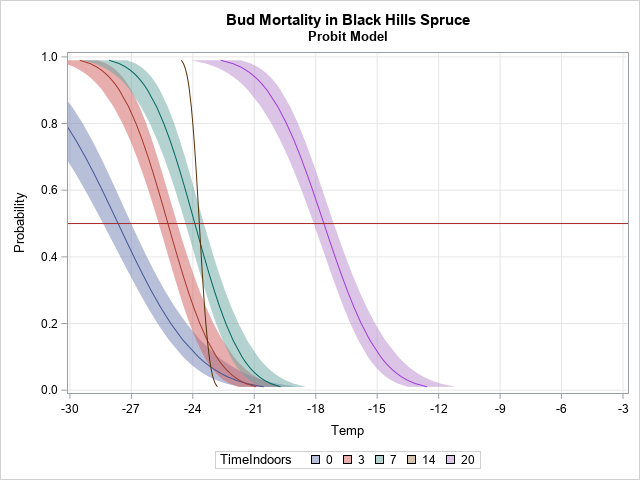

"O Christmas tree, O Christmas tree, how lovely are your branches!" The idealized image of a Christmas tree is a perfectly straight conical tree with lush branches and no bare spots. Although this ideal exists only on Christmas cards, forest researchers are always trying to develop trees that approach the


Recent money-laundering scandals have shaken public trust in the banking sector. How can banks rethink their approach to AML? The BBC’s recent Panorama documentary, “Banking Secrets of the Rich and Powerful,” is an uncomfortable watch for anyone working in the banking sector. While all banks have anti-money laundering (AML) teams


All analytics projects have data as their foundation and this data is usually spread across a variety of databases, storage systems and locations. This diverse and complex landscape causes data scientists to spend an inordinate amount of time searching for the right data and preparing this information for analytics. It’s


O planejamento da demanda é uma das tarefas mais complicadas dentro das grandes empresas. Resumidamente, ele consiste na capacidade de se planejar para que o produto certo esteja disponível no momento certo, na quantidade correta e no local certo. Ou seja: é ele quem garante que sempre que o cliente

Data, IA et transformation numérique pour l'Industrie du Futur. Fini de jouer ! Sans une approche industrielle c'est "No future" ! Les diamants sont éternels… KHEPRI, divinité mythologique de l’Égypte ancienne symbolisant la renaissance matinale du soleil, aurait inspiré le logo d’une marque automobile centenaire, véhicule de fonction culte d’un célèbre agent
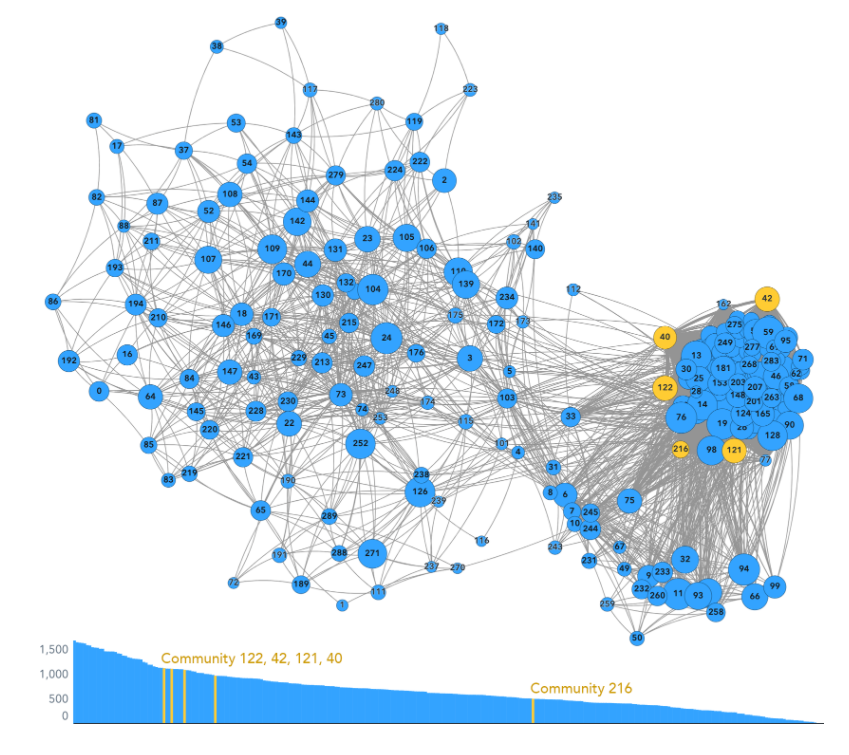

Often, when a cybersecurity incident occurs, the clues to how it happened and who caused it are hidden in network data. In the example discussed here, data scientists were asked to identify who caused a global internet outage by examining a large graph of network data with data visualization. This


Hace un año, por esta época, empezábamos a hacer balances y a proyectar lo que sería el 2020. Nadie podía llegar a imaginar lo que viviríamos, las situaciones que tendríamos que afrontar y los cambios que nos aguardarían. Incluso, poder predecir con el poder de la analítica, nuestra especialidad, ha
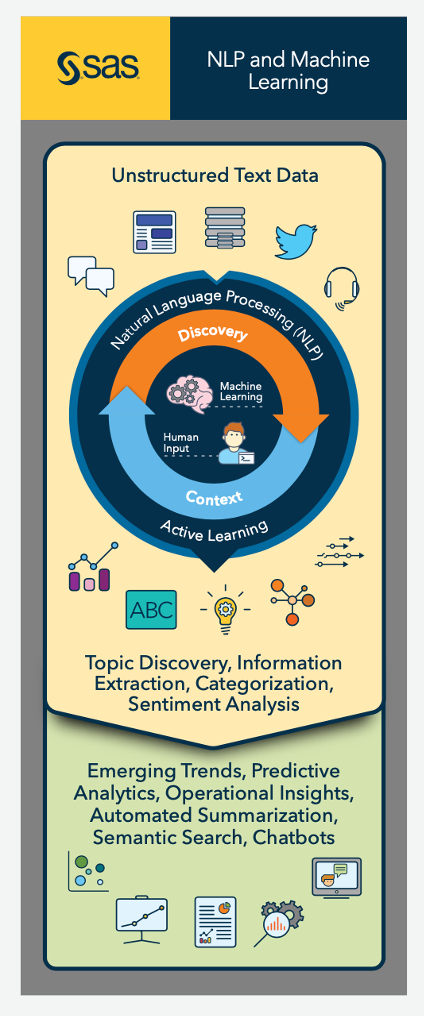

비정형 텍스트 데이터는 인류가 생성하는 가장 큰 데이터입니다. 더 나은 비즈니스 결정을 내리고, 제품 전략을 알리고, 고객 경험 개선에 도움이 되는 유용한 정보가 바로 이 데이터에 포함되어 있습니다. 비정형 텍스트 데이터의 잠재력을 최대한 활용해야 하는 이유입니다. 본 시리즈에서는 텍스트 데이터에서 인사이트를 얻는 주요 방법과 이를 위한 SAS 솔루션을 살펴봅니다. 전

We've turned some of our most notable predictions for next year into a slide show. Click the orange "next" button to see these 2021 predictions from SAS. Who’s brave enough to make predictions for next year after the unpredictable year we just had? We are. After all, the disruptive

Some people hear the words computer science and only think of coding but ask any computer scientist and they would tell you that coding is just a tool to solve important and interesting problems. At its core, computer science is about using technology to solve complex problems in the world,
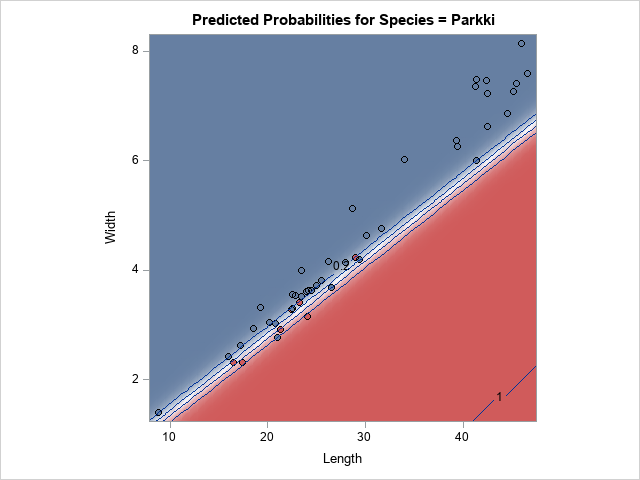
A SAS customer asked a great question: "I have parameter estimates for a logistic regression model that I computed by using multiple imputations. How do I use these parameter estimates to score new observations and to visualize the model? PROC LOGISTIC can do the computation I want, but how do
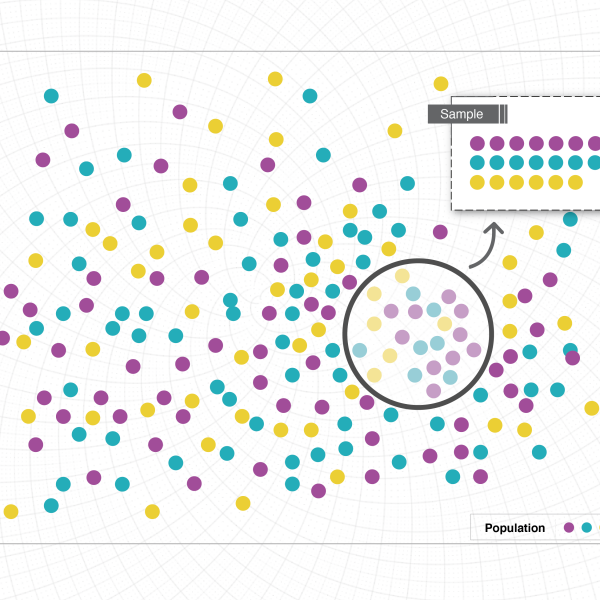
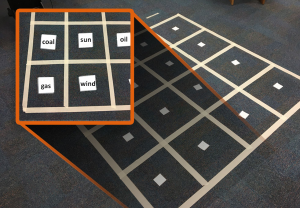
Editor's note: This blog post is part of a series of posts, originally published here by our partner News Literacy Project, exploring the role of data in understanding our world. As discussed in previous posts, statistics and visual representations of data can be misleading. But what happens when the data itself is misleading? And if data is


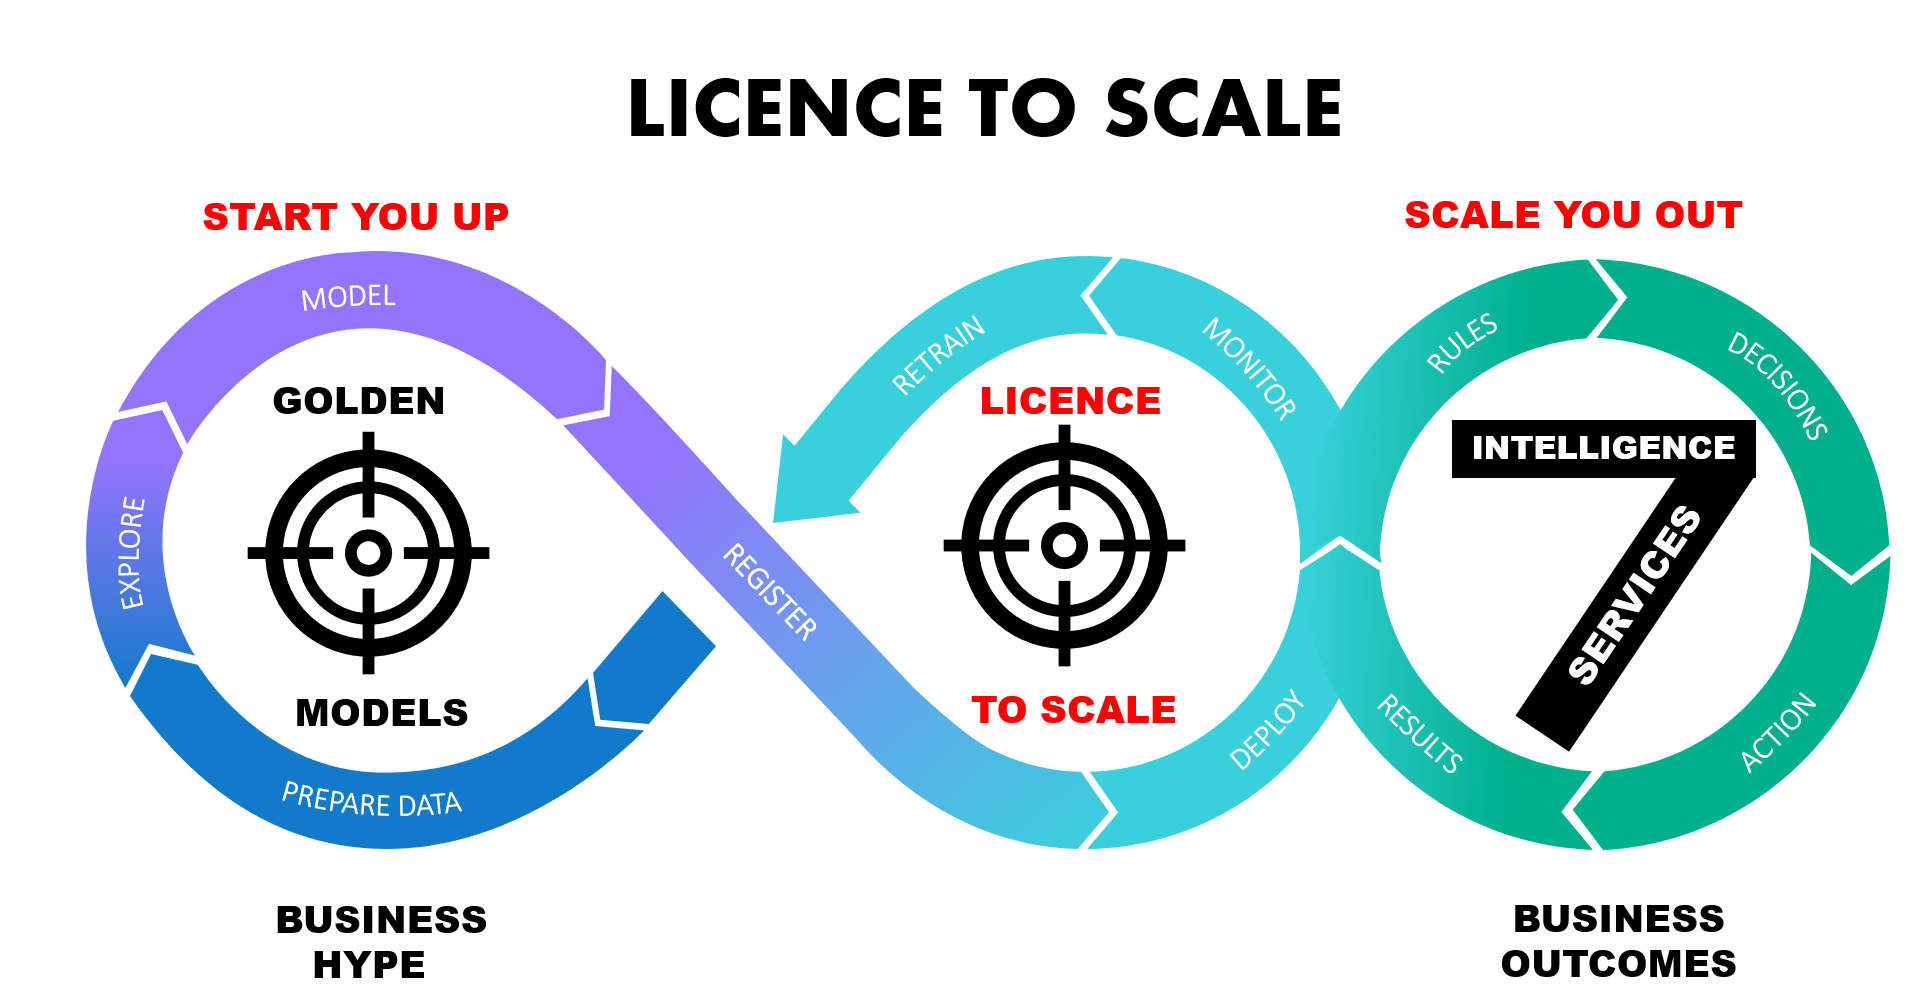
A note from Udo Sglavo: A wealth of connectivity is pervasive in the data we gather across many industries. In other words, networks are all around us. A data science trend you cannot ignore is to organize, learn from, and drive decision-making based on connected data. Network analytics engines provide efficient