
 A note from Udo Sglavo: A wealth of connectivity is pervasive in the data we gather across many industries. In other words, networks are all around us. A data science trend you cannot ignore is to organize, learn from, and drive decision-making based on connected data. Network analytics engines provide efficient solutions to a broad range of business problems. To help familiarize you with the network science capabilities of SAS Viya, Brandon Reese, Senior Machine Learning Developer in Scientific Computing R&D, demonstrates how to represent data as a network, run standard network science algorithms, and interpret the results.
Introduction
Network science is a mature but growing field that provides insights based on the known or inferred connectivity in data. In this post, I will introduce the NETWORK and OPTNETWORK Procedures, SAS® Viya software’s toolkit for working with networks, including hands-on examples. While these examples use social media data, network analytics can be used to analyze networks of every type - solving crimes, understanding the spread of disease, building community structures, and much more.
For the full working example code, please visit this GitHub link.
Defining a data model
The first step in analyzing connected data is often data modeling. This step consists primarily of two tasks. The first is identifying which entities in your data to represent as nodes. The second task is identifying which associations in your data to represent as links. Furthermore, any data fields that provide additional information about the nodes or links that will be relevant to your analysis can be added to the graph as attributes.
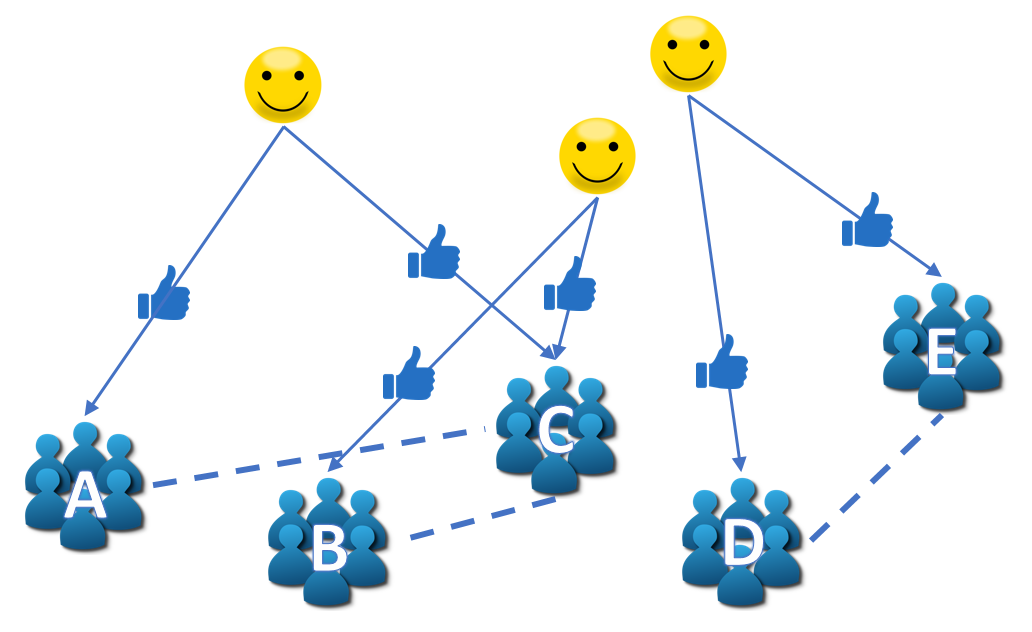
The example presented above illustrates the format of some raw social network data. For this analysis, the nodes are chosen to be social media pages of government-related entities (A through E). For links, we consider two nodes to be associated if one or more sampled users "like" both pages. In our chosen data model, these page-page links (the dashed lines) are the links to be considered in the subsequent analysis.
In the data set available for download here, the data has already been prepared in two files. The nodes are listed in file “fb-pages-government.nodes” and the links are listed in the file “fb-pages-government.edges”. When your data is in a format similar to these, with nodes and their attributes in a delimited file or database table, and edges and their attributes in another delimited file or database table, you can import and directly run various types of network analytics by using SAS® Viya.
Let’s take a look at the network data and explore some of the analysis possible with PROC NETWORK (or, equivalently, the Network action set).
Reading the network into nodes and links tables
The first step is to import the links and nodes data tables by using the DATA step.
Next, we show a rendering of the entire network:
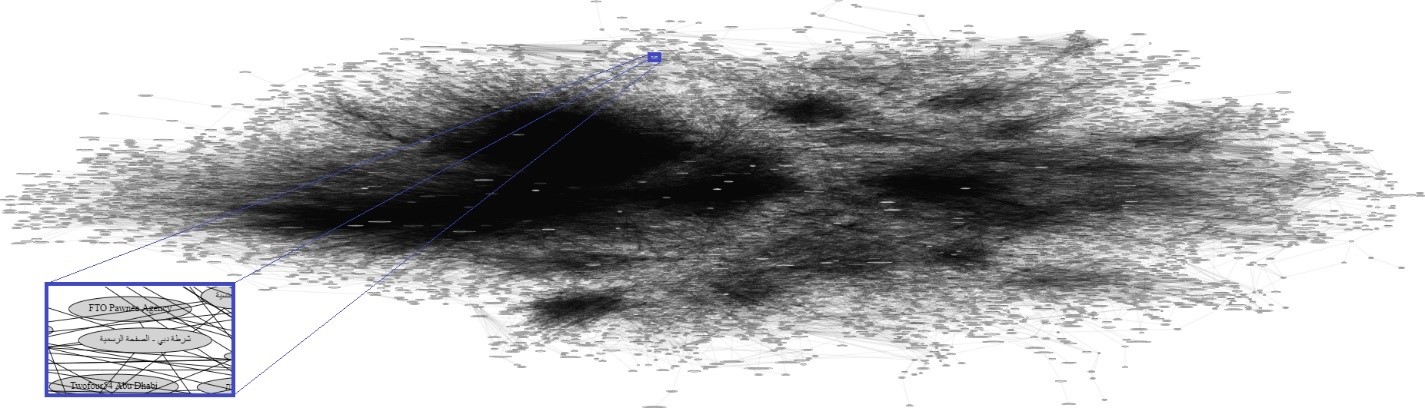
With over 7,000 nodes and 89,000 edges, it is very difficult to gather insights from the whole raw graph. A plausible first step might be to perform community detection, one of many network science capabilities included with SAS® Visual Data Mining and Machine Learning. By using community detection, you can break a graph down into more manageable subgraphs. The goal is to define communities that have a dense count of links within each community relative to the counts of links between disparate communities. of links between disparate communities.
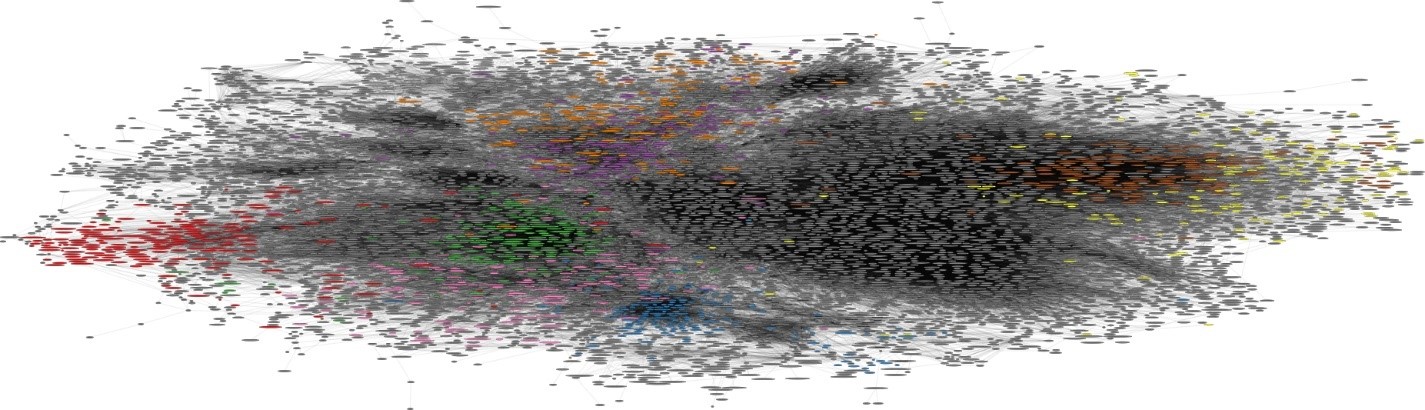
Community detection in a social network
You can use the COMMUNITY statement in PROC NETWORK to perform community detection. Here are the nine largest communities visualized by separate node colors overlaid on the whole graph:
And here are the same nine communities visualized separately:
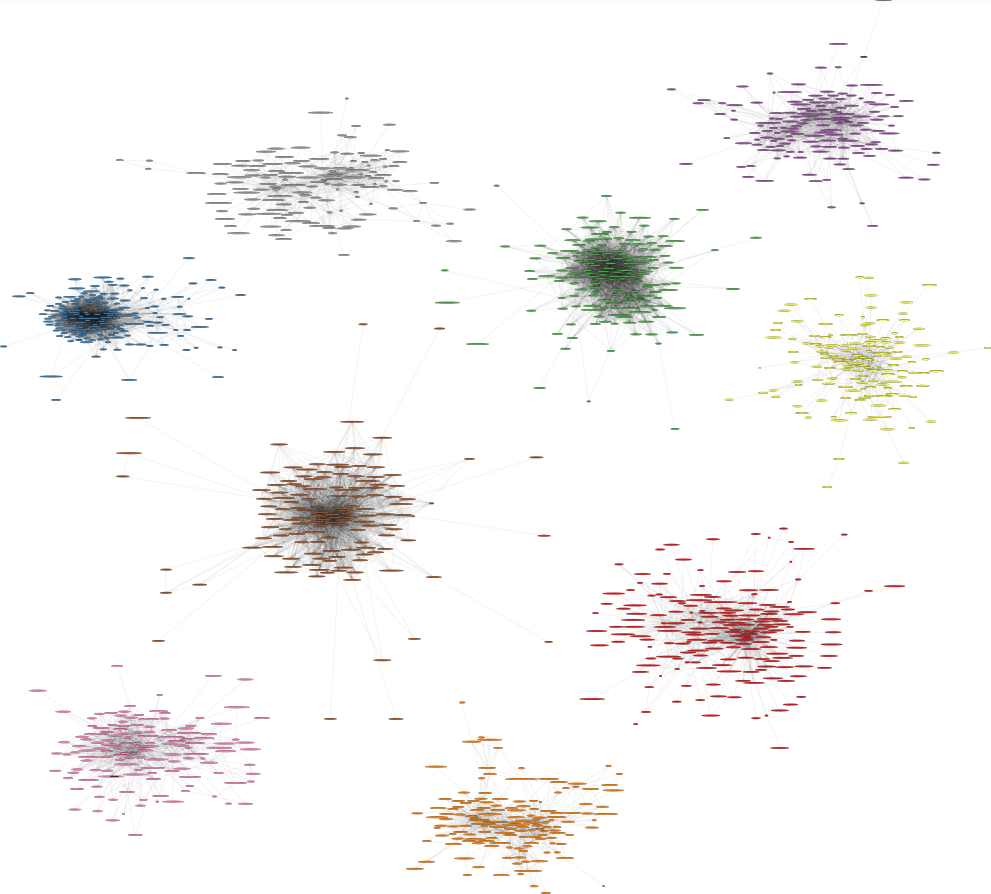
Once we start looking at individual communities, the network visualizations can become far more meaningful.
PageRank centrality to measure node importance
One useful technique for quantifying the relative importance of each node in a network is to use any of the many centrality metrics, one of which is PageRank centrality. This algorithm produces rank values for each node that are proportional to the sum of neighboring nodes’ rank values. With PROC NETWORK, you can compute the PageRank by using the CENTRALITY statement.
Here is a visualization of a single community that appears to have an “emergency response” theme. The size of the nodes displayed is proportional to their PageRank centrality.
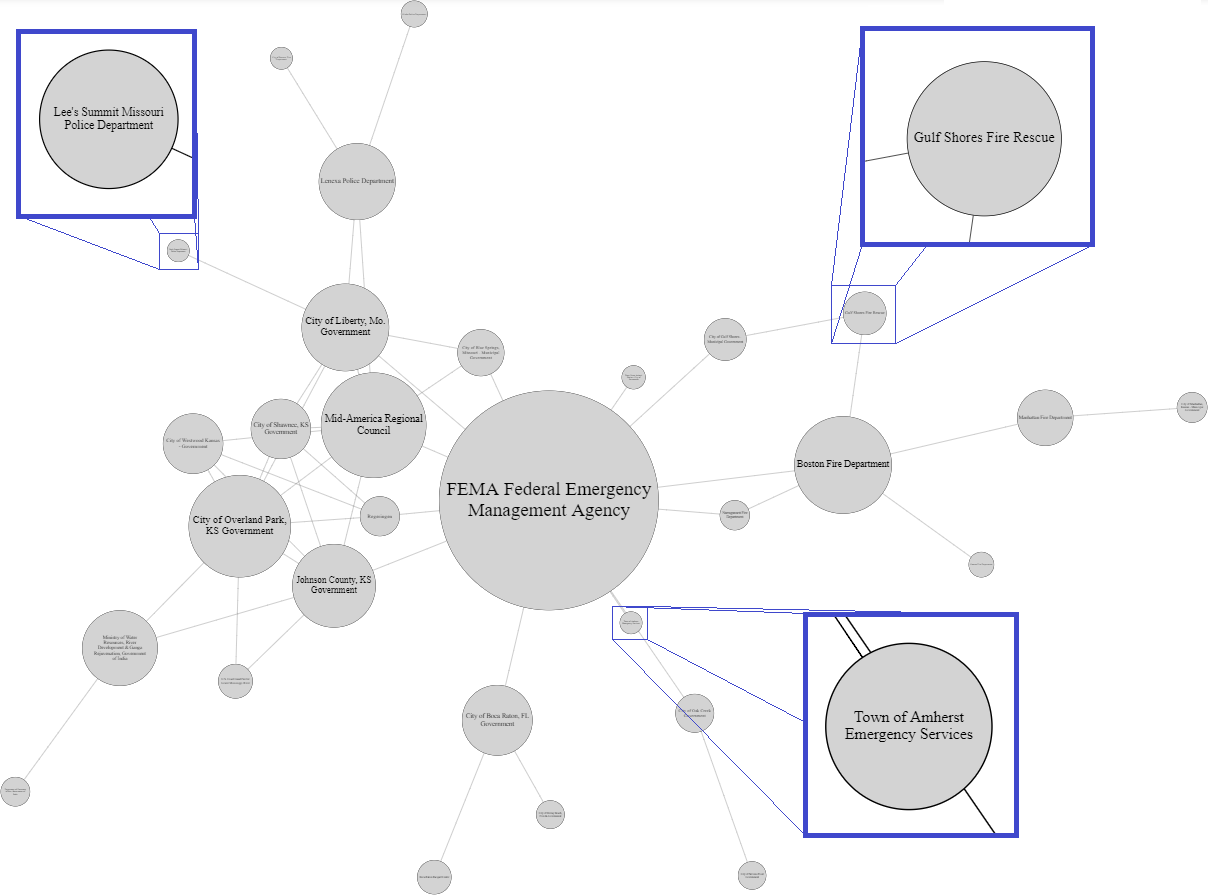
Note how the most central node, that is, the node with the highest PageRank centrality, is FEMA, a large-scale emergency response organization. On the other hand, many of the peripheral nodes are local emergency response organizations.
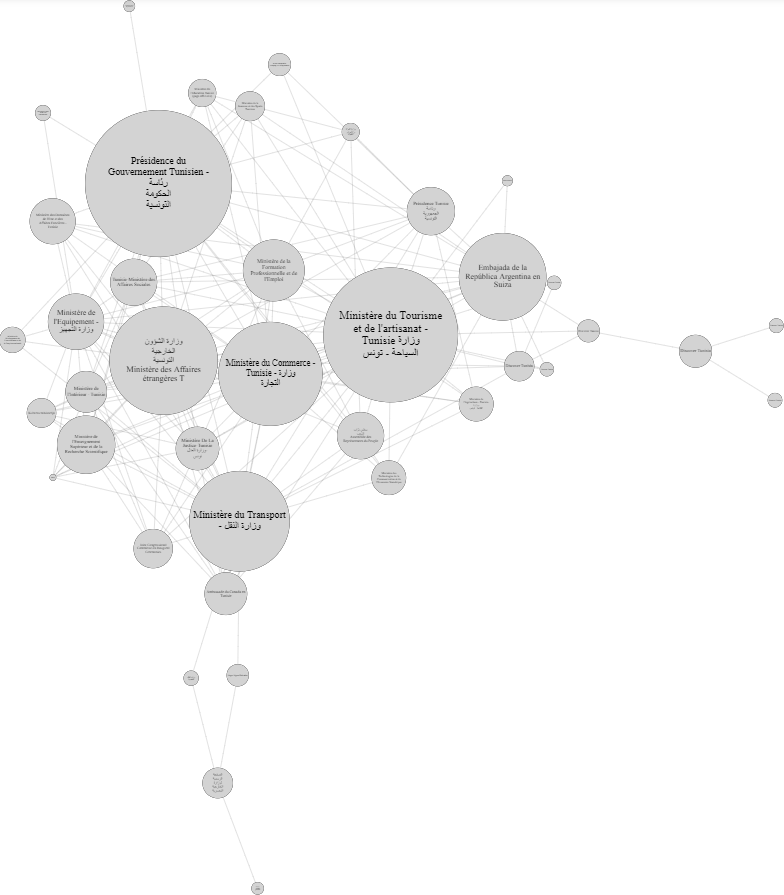
Here is another community that is mainly focused on Tunisian government pages:
Finding maximal cliques in a social network
Cliques are subgraphs that are even denser than communities. By definition, all nodes in a clique are linked to all other nodes within that clique. You can use cliques to find very strongly associated clusters in the government social media pages graph. With PROC NETWORK, you can find cliques containing eight or more nodes by using the CLIQUE statement.
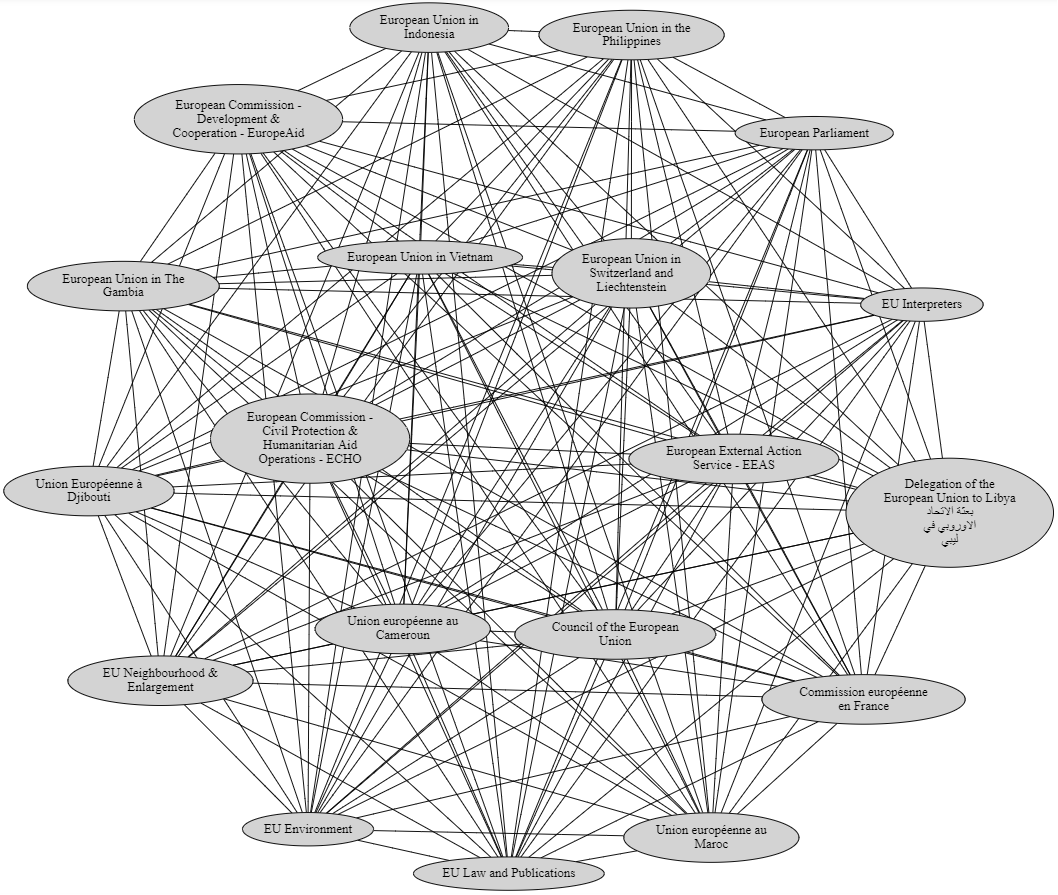
Here is a visualization of one clique that connects nineteen European-Union-related pages.
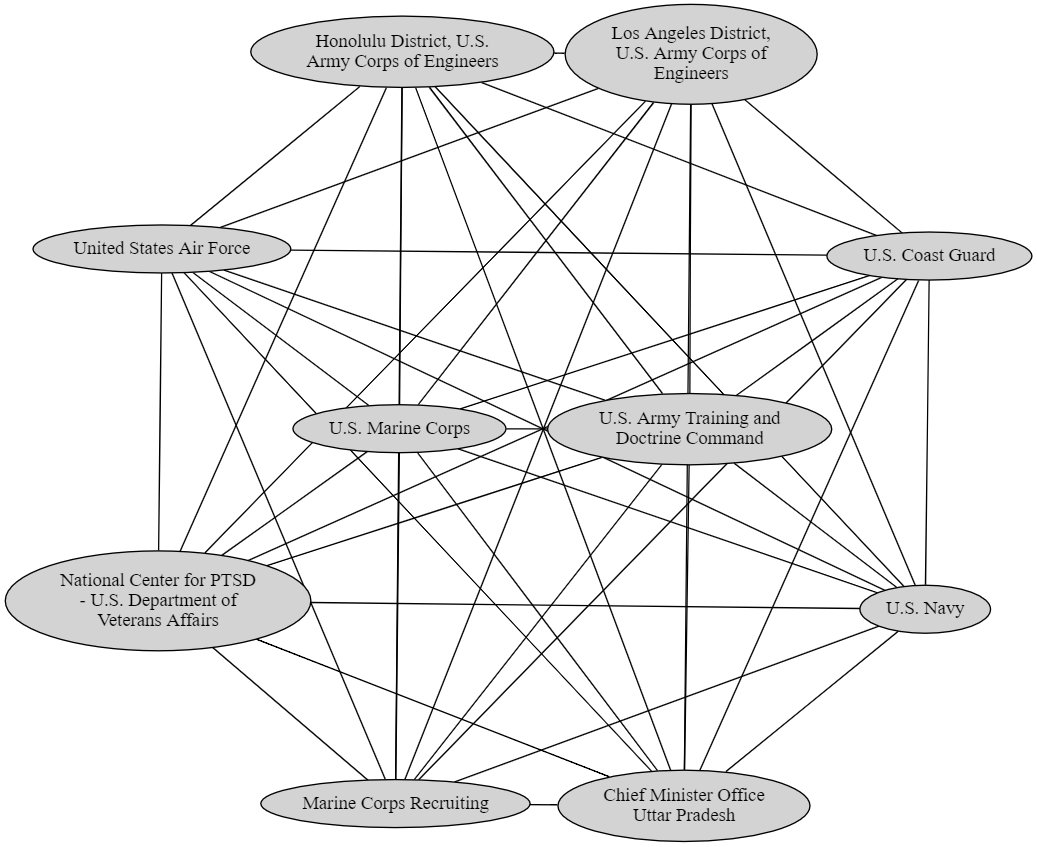
And here is another clique, representing pages related to the US Armed Forces:
Quantifying the pairwise similarity of nodes
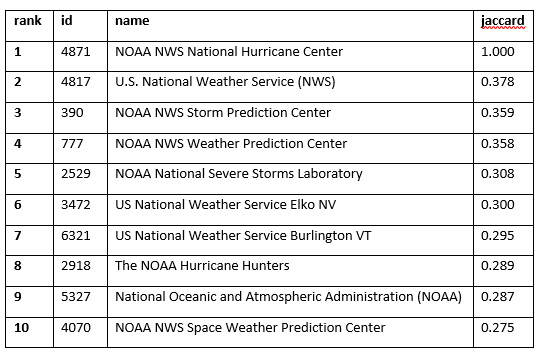
When comparing two nodes, it is often useful to consider similarities between the neighborhoods surrounding each node. Several methods for quantifying node similarity are available by using the PROC NETWORK NODESIMILARITY statement. For example, you can use node similarity to determine the pages that are most similar to “NOAA NWS National Hurricane Center”.
Here are the top 10 most similar nodes by Jaccard node similarity.
Network analytics at scale
One capability that sets SAS® Viya apart is the ability to perform complex analysis and optimization on networks at scale. The next example considers a larger data set, which can be downloaded from here. In this data set, links represent posts on the Reddit platform from one subreddit community to another. Each link also has sentiment attributes that indicate whether the post has a positive or negative connotation. This data set contains approximately 54,000 nodes and 600,000 links but is light work for SAS Viya, as both the upcoming patternMatch and minimum spanning tree snippets run in under one second.
Locating instances of an interesting pattern
To analyze the Reddit sentiment network, you can use patternMatch to search for instances of patterns of interest (subgraphs) within the entire network. The illustrated pattern, or query graph, represents a topology of three subreddit nodes, A, B, and C, connected by six directed links. The subreddit A was linked in negative-sentiment posts from both B and C. The other links forming the subgraph, however, have positive sentiment.
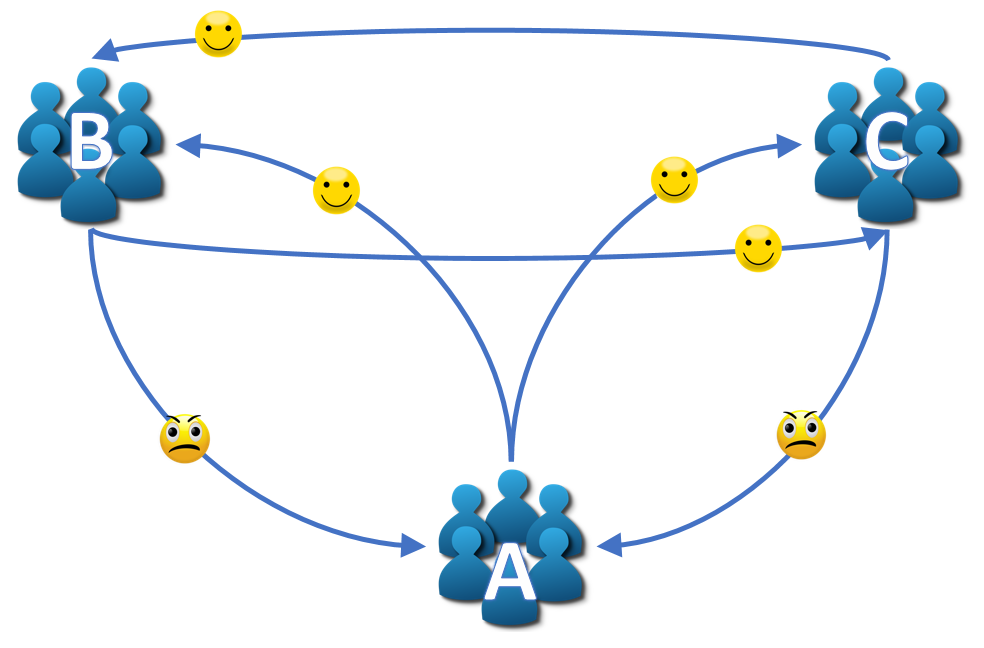
Let’s search for this pattern throughout the entire network. Perhaps the subreddits that appear more frequently as node A in this pattern represent topics that typically receive heavy criticism.
You can invoke the pattern matching algorithm by using the PATTERNMATCH statement.
One of the matches found when searching the pattern of interest is depicted here:

Here, a link weight of positive one represents a post with positive sentiment, and negative one represents negative sentiment.
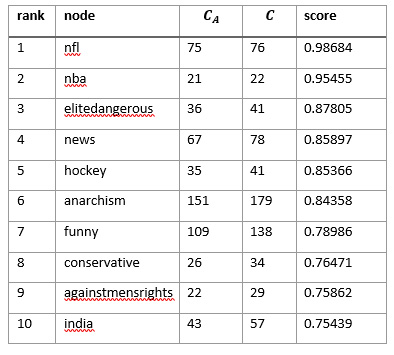
In all, 3,351 matches were found by patternMatch, and the query took just 0.6 seconds. In order to quantify the subreddits that are most prone to receive negative criticism, let’s define a score as \({C_{A}\over C}\), where \(C_{A}\) is the number of times a node appears in a match as node A, and \(C\) is the number of times a node appears in any match. The top ten scoring nodes (read: topics that we love to hate) are given in this table:
Now you’ve seen a variety of ways to analyze and draw insight from connected data, so now what? To demonstrate optimization over the Reddit sentiment data set, imagine you want to deploy a word-of-mouth marketing campaign.
Computing a minimum spanning tree
Let’s say studies have shown that subscribers to a given subreddit community are more likely to engage with ads that come from another subreddit when the subreddits are linked by posts with positive sentiment. You can use the minimum spanning tree algorithm to determine how to show the word-of-mouth ad to all subreddits, maximizing the total overall subreddit-to-subreddit sentiment. By choosing weights that are inversely proportional to overall sentiment, you can solve this problem with a minimization algorithm.
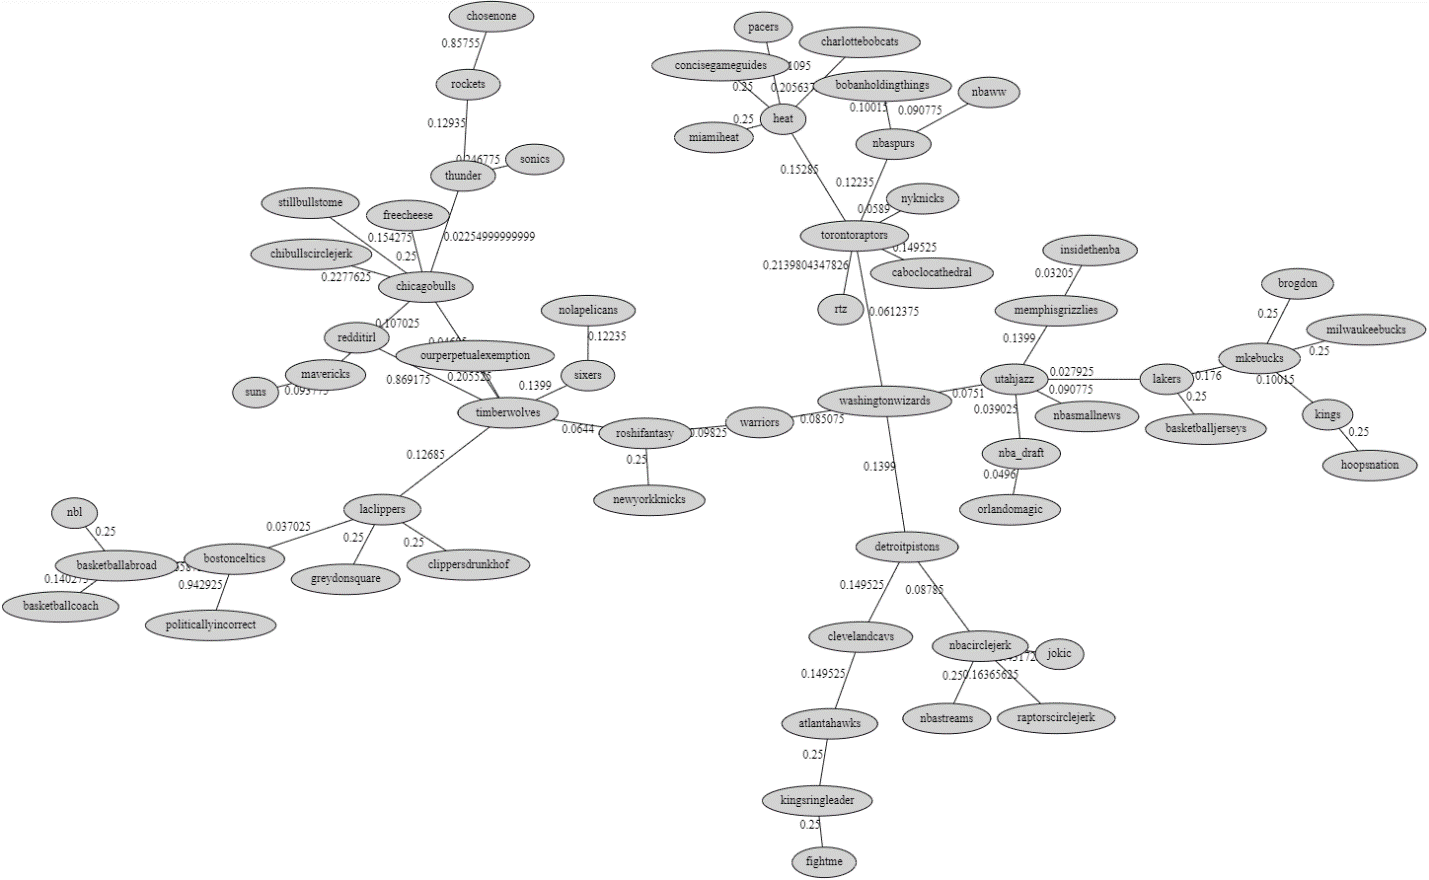
You can compute a minimum spanning tree by using the MINSPANTREE statement in PROC OPTNETWORK.
Here are the results, shown only for a single community, because the whole graph is too large to easily visualize. Each link represents a recommended word-of-mouth advertisement post linking from one subreddit community to another. For the entire Reddit data set, the minimum spanning tree action took about 0.15 seconds to complete.
Epilogue
These are just a handful of the SAS Viya capabilities that allow you to analyze network connections in your data. For more details and a complete list of algorithms, head over to the documentation pages for Network and documentation pages for Optnetwork.
For more detailed illustrations of the possibilities of network science, check out these recent articles, which highlight how SAS is helping customers combat the coronavirus pandemic using network analysis.
- Mobility tracing: Helping local authorities in the fight against COVID-19
- Jump-start COVID-19 research with text analytics
LEARN MORE | SAS Contact Tracing
This is the sixth post in our series about statistics and analytics bringing peace of mind during the pandemic.


1 Comment
This is a useful and excellent share. Will definitely share it with people I know. And also read this about science fictions The Dos and Don’ts of Writing Science Fiction
Thanks!