Often, when a cybersecurity incident occurs, the clues to how it happened and who caused it are hidden in network data. In the example discussed here, data scientists were asked to identify who caused a global internet outage by examining a large graph of network data with data visualization.
This exercise was part of the IEEE Visual Analytics Science and Technology (VAST) Challenge. A team of SAS volunteers submitted a solution for Mini Challenge 1, which required us to analyze synthetic network data related to a worldwide cyber event. As part of the challenge, we were asked to use Center for Global Cyber Strategy (CGCS) data to identify candidate groups that authorities could approach for assistance in restoring the internet. Provided data included a very large main graph (>100 million edges) and smaller seed graphs to be used to find matches. So we assembled a team and deployed a SAS® Viya® environment to take on the challenge.
The process
We used SAS® Visual Analytics and the NETWORK procedure from SAS® Visual Data Mining and Machine Learning to tackle the problem. Our process involved combining visualizations and network algorithms to uncover patterns that discriminate between candidate matches and the template graph of interest to locate these patterns in the full graph. We describe the techniques and strategies for solving this problem in more detail and discuss potential future improvements here and in the video below.
Pattern matching, the process of finding instances of a subgraph (query graph) in a larger network, is a problem that has applications in many areas, including social network analysis, fraud detection, and biology. For this challenge, we utilized the pattern matching capabilities in SAS Visual Data Mining and Machine Learning to help identify groups that most closely resemble the hacker profile template graph.
Process and tools
A core part of our solution leveraged network analytics from SAS Visual Data Mining and Machine Learning 8.5. Network Analytics offers a wide range of functionality for analyzing networks, and we utilized different algorithms for this challenge. Most significantly, we relied on the PATTERNMATCH statement, which can be used to find all the subgraphs that are the same as or similar to a given pattern graph in a data graph. Through the use of the SAS Function Compiler (FCMP), it gives the user the ability to specify a set of functions to add user-defined conditions that the subgraph must satisfy to be considered a match.
This functionality enables exact node and link attribute matching, such as requiring that the weight of a link be greater than some specified value. In addition, global conditions can be specifiedll, such as requiring that the timestamp on a communication link be within a week of the timestamp on a travel link.
The solution
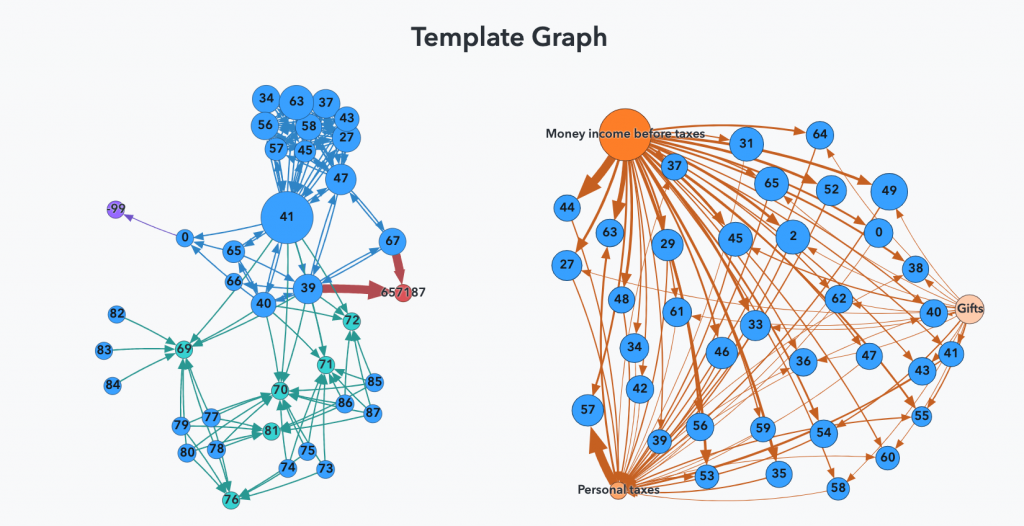
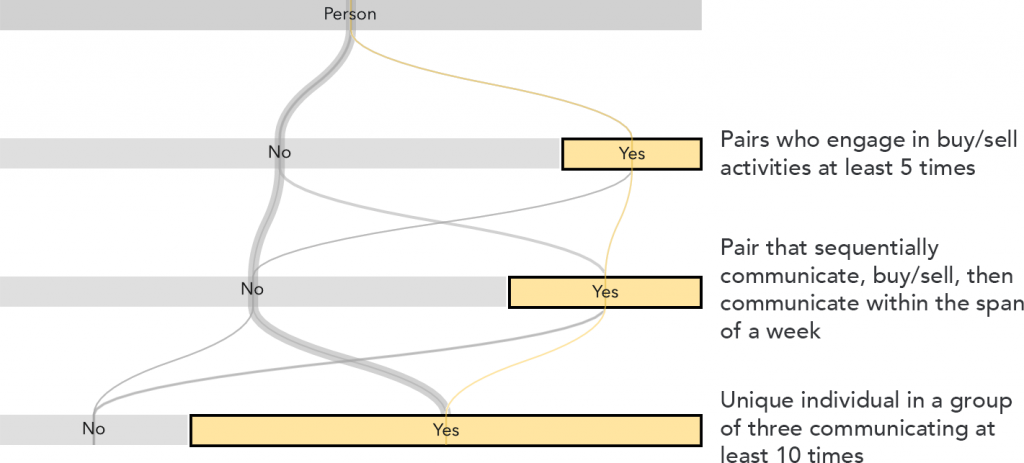
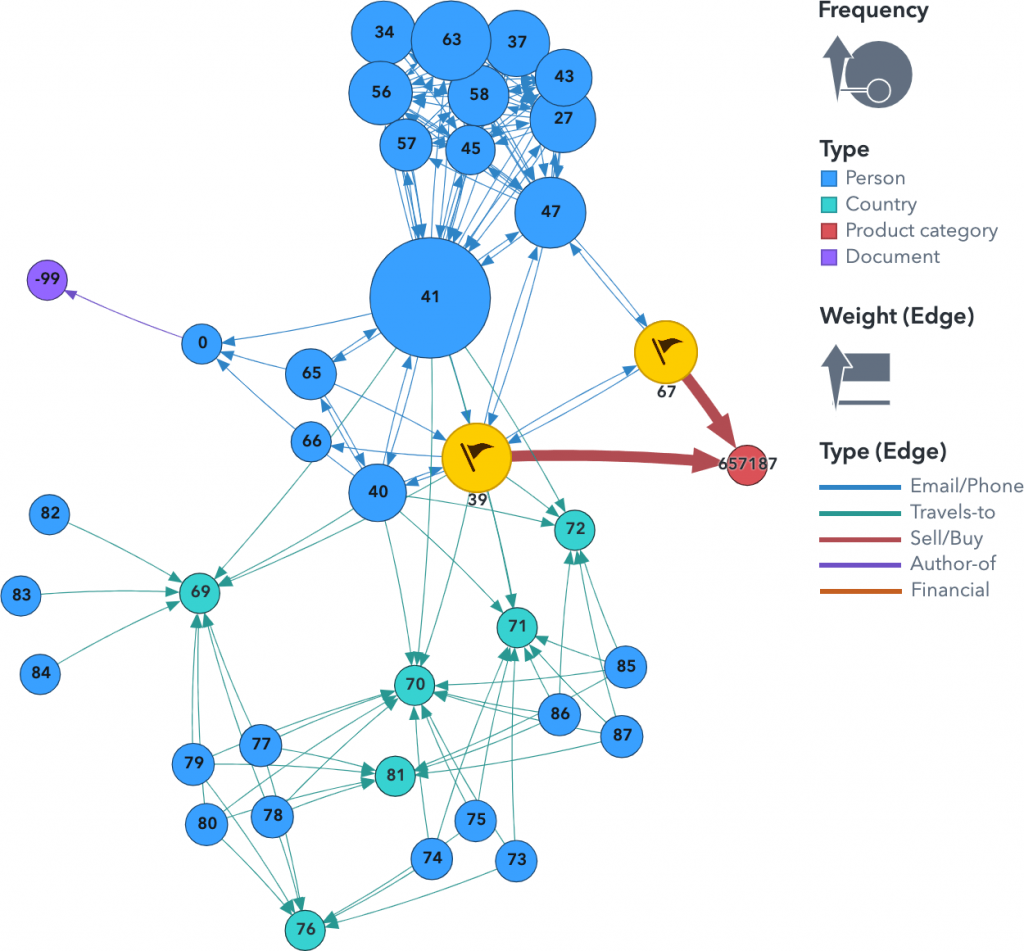
We examined the network structure and observed the initial differences between the candidate graphs and the template graph with SAS Visual Analytics. To quantify these differences, we systematically compared the candidate and template graphs by using the PATTERNMATCH statement. We created a set of relatively simple subgraphs for the different link types (for example, a buy/sell action between two people) and incrementally added complexity to these patterns. Then, we used the PATTERNMATCH statement to find the number of matches to these patterns in the candidate and template graphs.
Video submission VAST 2020 (YouTube)
As expected, we were able to determine that the large graph contained no subgraph that exactly matched the template graph. So, to locate potential template matches in the full graph, we took patterns that occurred in the template graph, searched for those patterns in the full graph, and then examined the network around those patterns. To make subsequent visualization and analysis more tractable, we focused on patterns that were rare in the full graph.
Results
To complete the challenge, we answered all questions provided and submitted a comprehensive document explaining every step in our analysis, including the final identification of the group responsible for the outage.
Our work earned us an honorable mention certificate and we were invited to present our solution at this year's VAST Challenge 2020 workshop - giving us the opportunity to highlight our approach and answer questions to the panel.
The VAST Challenge provides a great opportunity to validate our software against real-world scenarios and using complex data sets. Not only do we learn from these projects but we also send feedback to our development teams to further improve product capabilities for customers.
The team
Finding a solution to this problem wouldn't have been possible without the commitment and technical expertise of each individual. In particular, Steven Harenberg and Matthew Galati spent countless hours analyzing the graph data and making use of SAS Viya's excellent network analysis capabilities. Falko Schulz used SAS Visual Analytics to explore and visualize the data in order to tell a complete story and focus on the Mini Challenge related questions. Thanks to Riley Benson and Rajiv Ramarajan for their guidance during the project which involved compiling results, writing papers and presenting the solution. Also huge thanks to Rachel Nisbet, Shaun Kurian and Jesse Olley for the willingness and effort compiling a beautiful video summary. None of this would have been possible without each person.
Thanks again to the entire SAS team!
References
- VAST Challenge 2020
- Visual Analytics Benchmark Repository
- YouTube - Submission Video
- SAS Institute Inc. SAS Visual Data Mining and Machine Learning. (Online.) 2020.
- Matthew Galati and Steve Harenberg. “Introducing Pattern Matching for Graph Queries in SAS Viya 3.4.” Proceedings of the SAS Global Forum 2019 Conference. SAS Institute Inc. Cary, NC. 2019.
- SAS Institute Inc. SAS Visual Analytics. (Online.) 2020.