Editor's note: This blog post is part of a series of posts, originally published here by our partner News Literacy Project, exploring the role of data in understanding our world.
As discussed in previous posts, statistics and visual representations of data can be misleading. But what happens when the data itself is misleading? And if data is supposed to be based on fact, you might wonder how data can be misleading. It comes down to the way it's collected. It's essential to have a strict process of collecting data before analyzing or presenting it. To ensure the data is accurate and as representative as possible, we must pay special attention to how data is collected.
Here are some of the most important questions to consider when understanding how data is collected:
- Who or what is represented in this data?
- What questions are being asked?
Sample selection and data collection
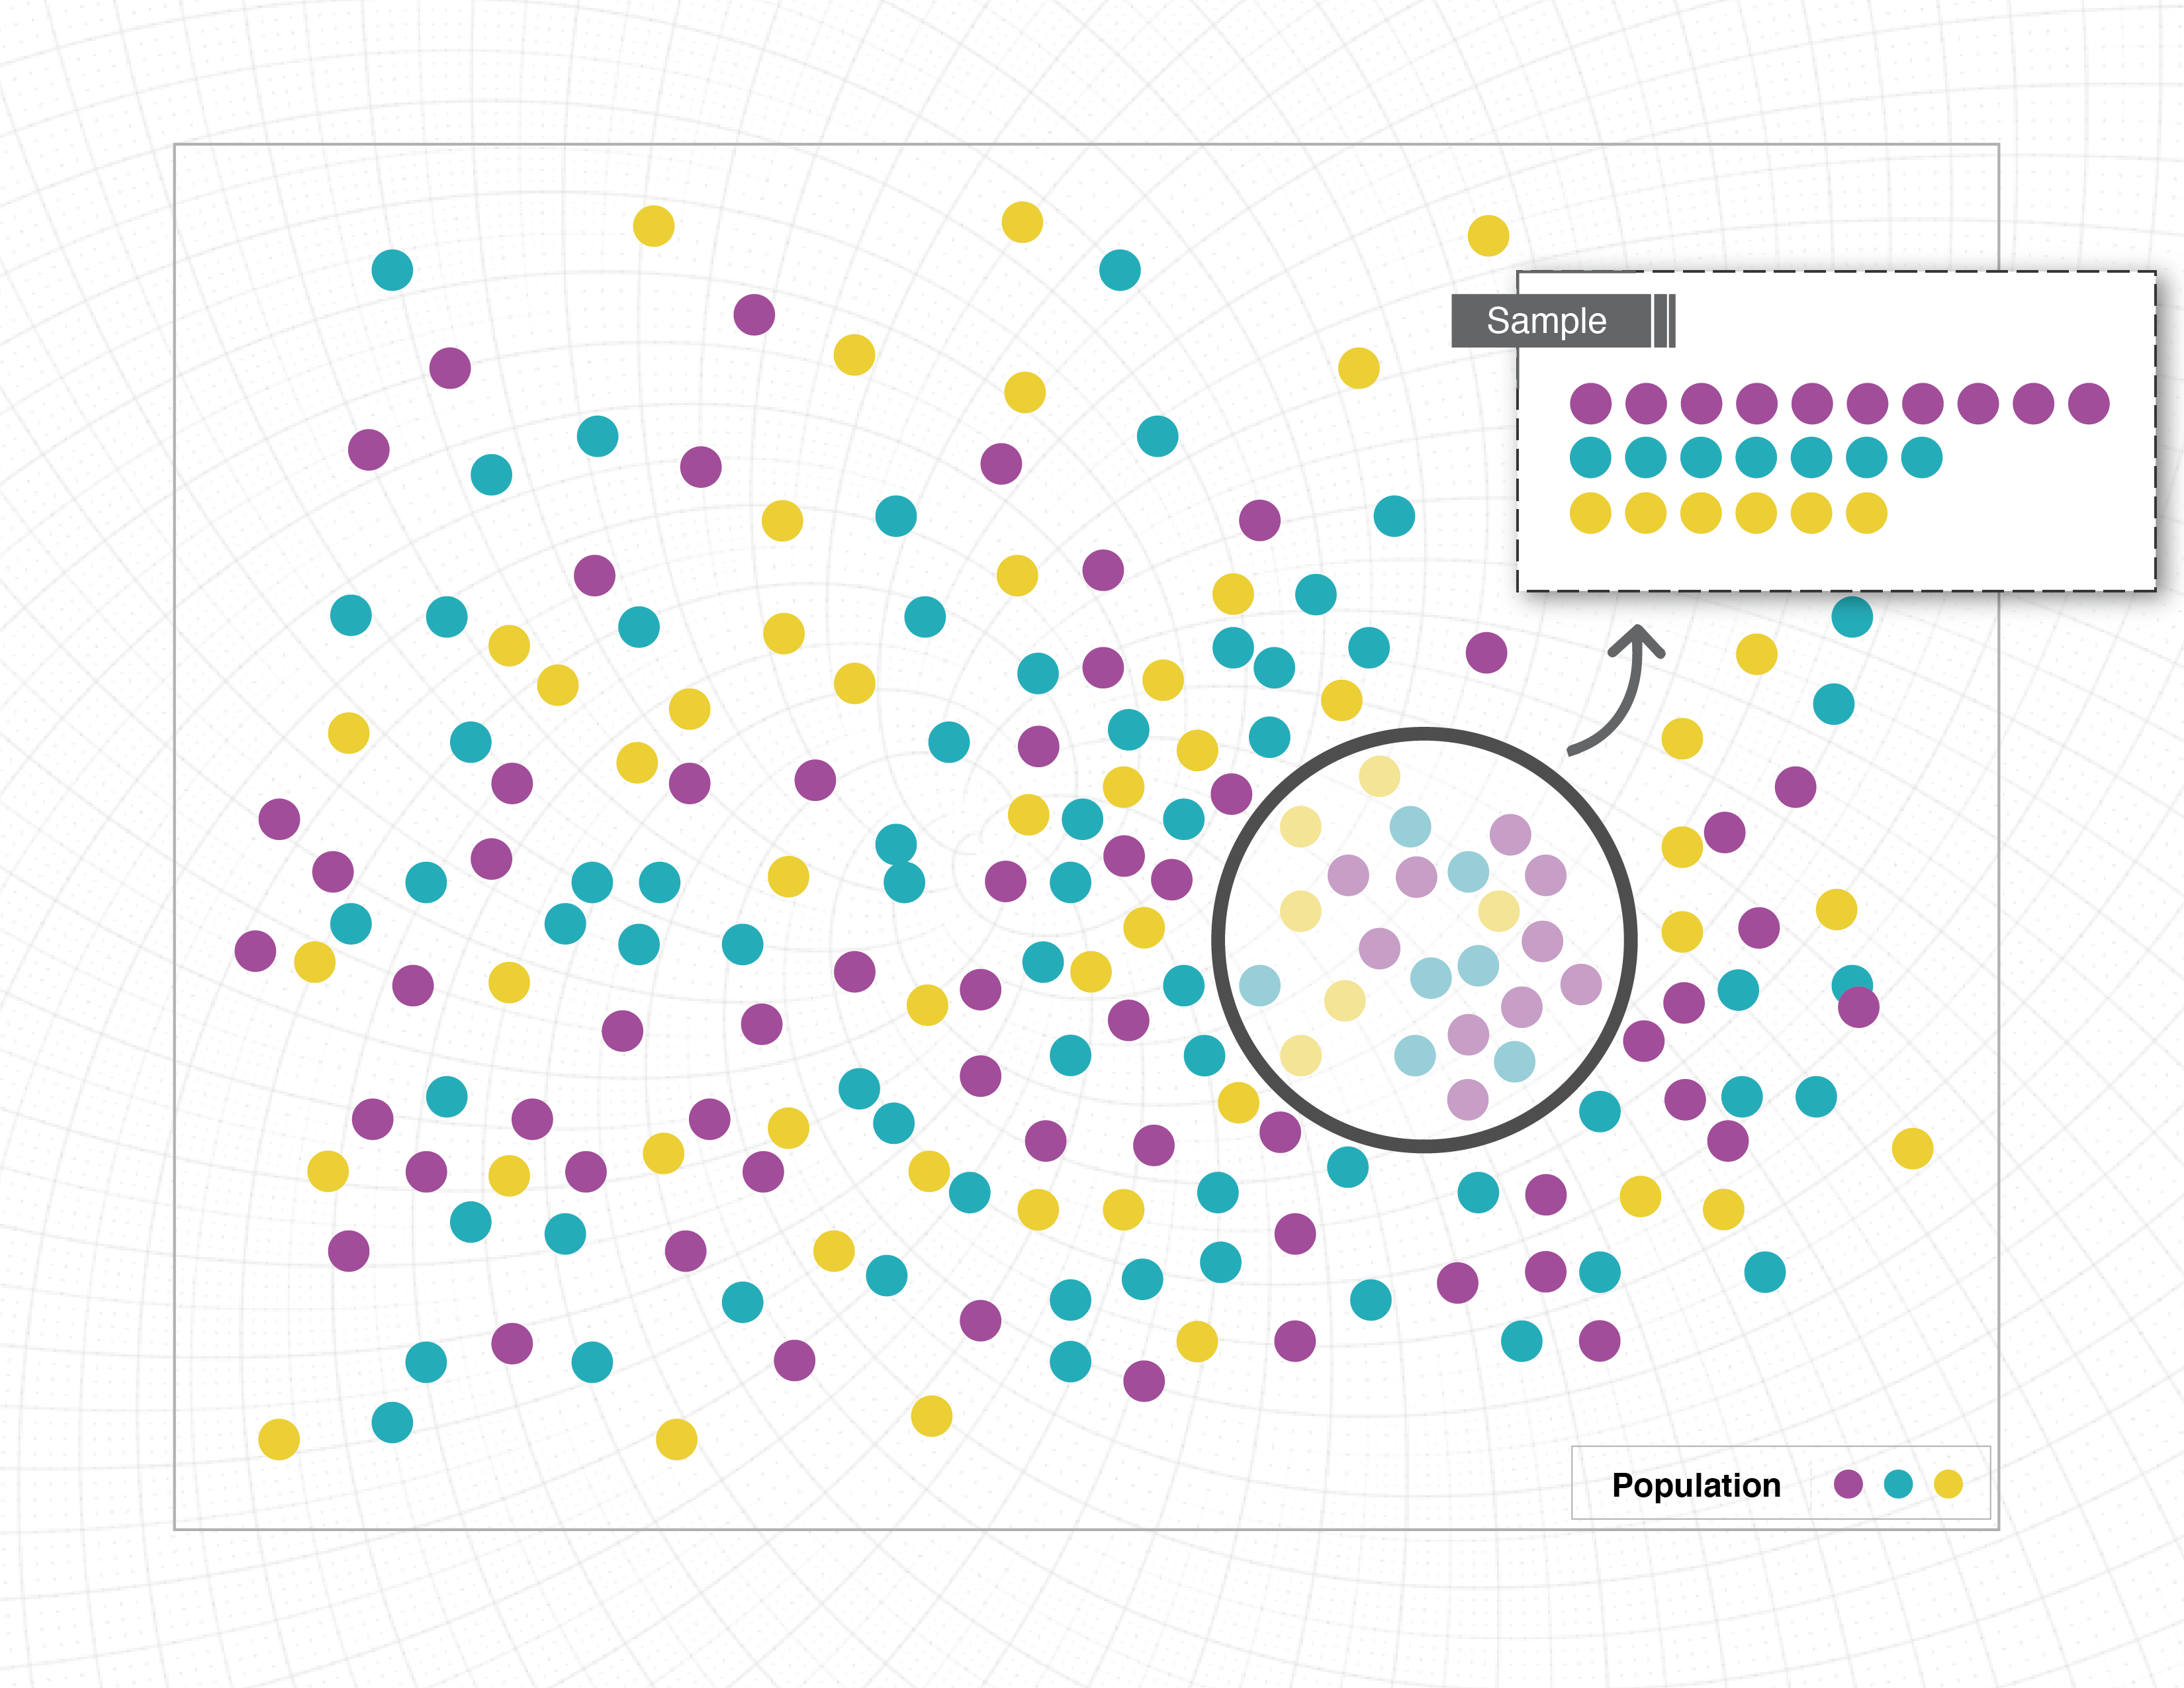
Without collecting data on an entire population, it’s nearly impossible to report it with complete accuracy because of sampling limitations. Suppose we want to better understand the eating habits of Americans. The only way to ensure we have an accurate picture of American eating habits is to monitor every single American, every second of the day, and record everything they eat. Since this is impossible, researchers will often use a sample, or a small portion of the population of interest. When the sample selected isn’t representative of the larger group, you get misleading data.
Consider how this might play out if someone was conducting a dietary study of Americans. In this case, the study asks 100 people about their eating habits. But how are those people selected? Options are endless:
- Collect data from 100 friends. That’s a convenient sample, but most people’s friends are about their age and eat similar types of foods.
- Gather data from a local restaurant or grocery store. Again, this might impact the type of data collected. For example, surveying people in a fast-food restaurant may give very different answers than surveying people in an upscale restaurant or a health food store.
- Conduct surveys at a non-food establishment, such as a library. This could be problematic, as library–goers might eat differently than the rest of the population. But even more concerning, those library–goers all come from the same area. The type of food people eat varies by locale. Those who live in cities likely eat different foods than those who live in rural areas. Food preferences can also vary depending on a person’s background or culture.
All of these are confounding factors or present possible issues with data. If we want a representative sample, we need to gather data from a cross section of age, gender, race, residence, income level, and so on. Finding such a representative sample can be incredibly difficult, and so it doesn’t often happen.
Researchers typically report the population used in samples. This helps the reader understand who is reflected in the sample and the impact that might have on the results. As a consumer of data, it’s important to pay close attention to this piece of information. Ask yourself if the results presented by the researchers apply to the whole population or if those results only apply to the population sampled.
Additionally, there can be issues when how the data is collected, or the questions asked, only tell part of the story. We said before that the best way to see what people are eating is to consistently monitor what they do, but getting firsthand access to information like this is often impossible or unethical. Instead, researchers design studies or questions to gather similar information. Consider the following scenarios:
- Researchers ask participants to keep a food log for a week that details everything they eat and track total servings of fruits, vegetables, meat, etc.
- Researchers ask participants “In general how many servings per day do you have of fruits, vegetables, meat, etc.?”
- Researchers ask participants “What kind of foods do you usually eat?”
Each of these scenarios is trying to answer the same question: What do people eat? But the information is being gathered in very different ways:
Scenario 1 seems closest to our observation study, but there are some ways that the data may be biased. One concern is that people know they’re recording their foods, and this may lead them to eat differently for the duration of the study. The data could also vary depending on the time of year. Many people make different food choices in the summer compared to the winter.
Scenario 2 also presents problems. This question asks people to think more holistically but relies on memory and judgment. Individual estimates of what is typical may vary from what is actually eaten. People may intentionally or accidentally make themselves appear to be healthier eaters than they really are. It can also be difficult to accurately judge your own behavior.
In Scenario 3, the question isn’t specific enough to gather good information. While people might report the amount of fruits and vegetables they eat, the question leaves room for general or unrelated answers, such as cuisine type (Italian, Mexican or others), or a preference to eat out or at home.
As you can see, the way questions are asked, and who is asked those questions, makes a big difference in the kind of information collected. Some questions are better than others. When interpreting data, see if you can find the questions asked by the researchers. Are they good questions? And are the results influenced by how the researcher asked them or how they gathered the data?
Join the bigger conversation about data literacy by reading this article in Datanami.
