All Posts


Chatbots offer another user-friendly conversational interface to the entire SAS Viya ecosystem, bringing together reporting capabilities, analytics and artificial intelligence.


If you want to hear more about Responsible AI, join the virtual conference “Artificial Intelligence & The Ethics Mandate” on March 16th at 11:00 am CET.
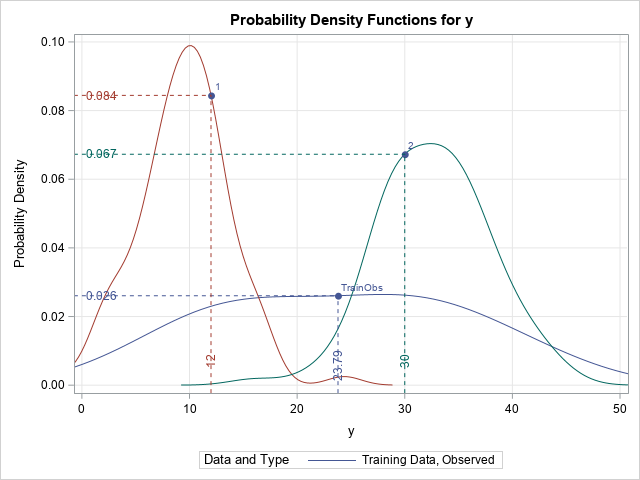

I recently learned about a new feature in PROC QUANTREG that was added in SAS/STAT 15.1 (part of SAS 9.4M6). Recall that PROC QUANTREG enables you to perform quantile regression in SAS. (If you are not familiar with quantile regression, see an earlier article that describes quantile regression and provides

My career path has taken me from the fields on my family farm to the boardrooms of organizations around the world. Starting when I was six years old, my summers involved working with my cousins on the farm from dawn until dusk. From a very early age, I learned the


Fight back against sophisticated money launderers with these 3 techniques.


As delinquencies rise in the wake of COVID-19, lenders must harness technology to orchestrate omnichannel contact strategies.


A key component to make sure that we develop responsible AI is diversity. This is because an AI application reflects and even amplifies the biases of its developers. As I discussed in my previous post, a diverse team will see things from many different points of view and help to


Generalmente hablamos de cómo los sectores económicos, las industrias y las empresas pueden aprovechar uno de los principales activos con los que cuentan en la actualidad -como son los datos- para proyectar diferentes escenarios, tomar mejores decisiones y ser cada vez más competitivas e innovadoras. También hay que hablar de


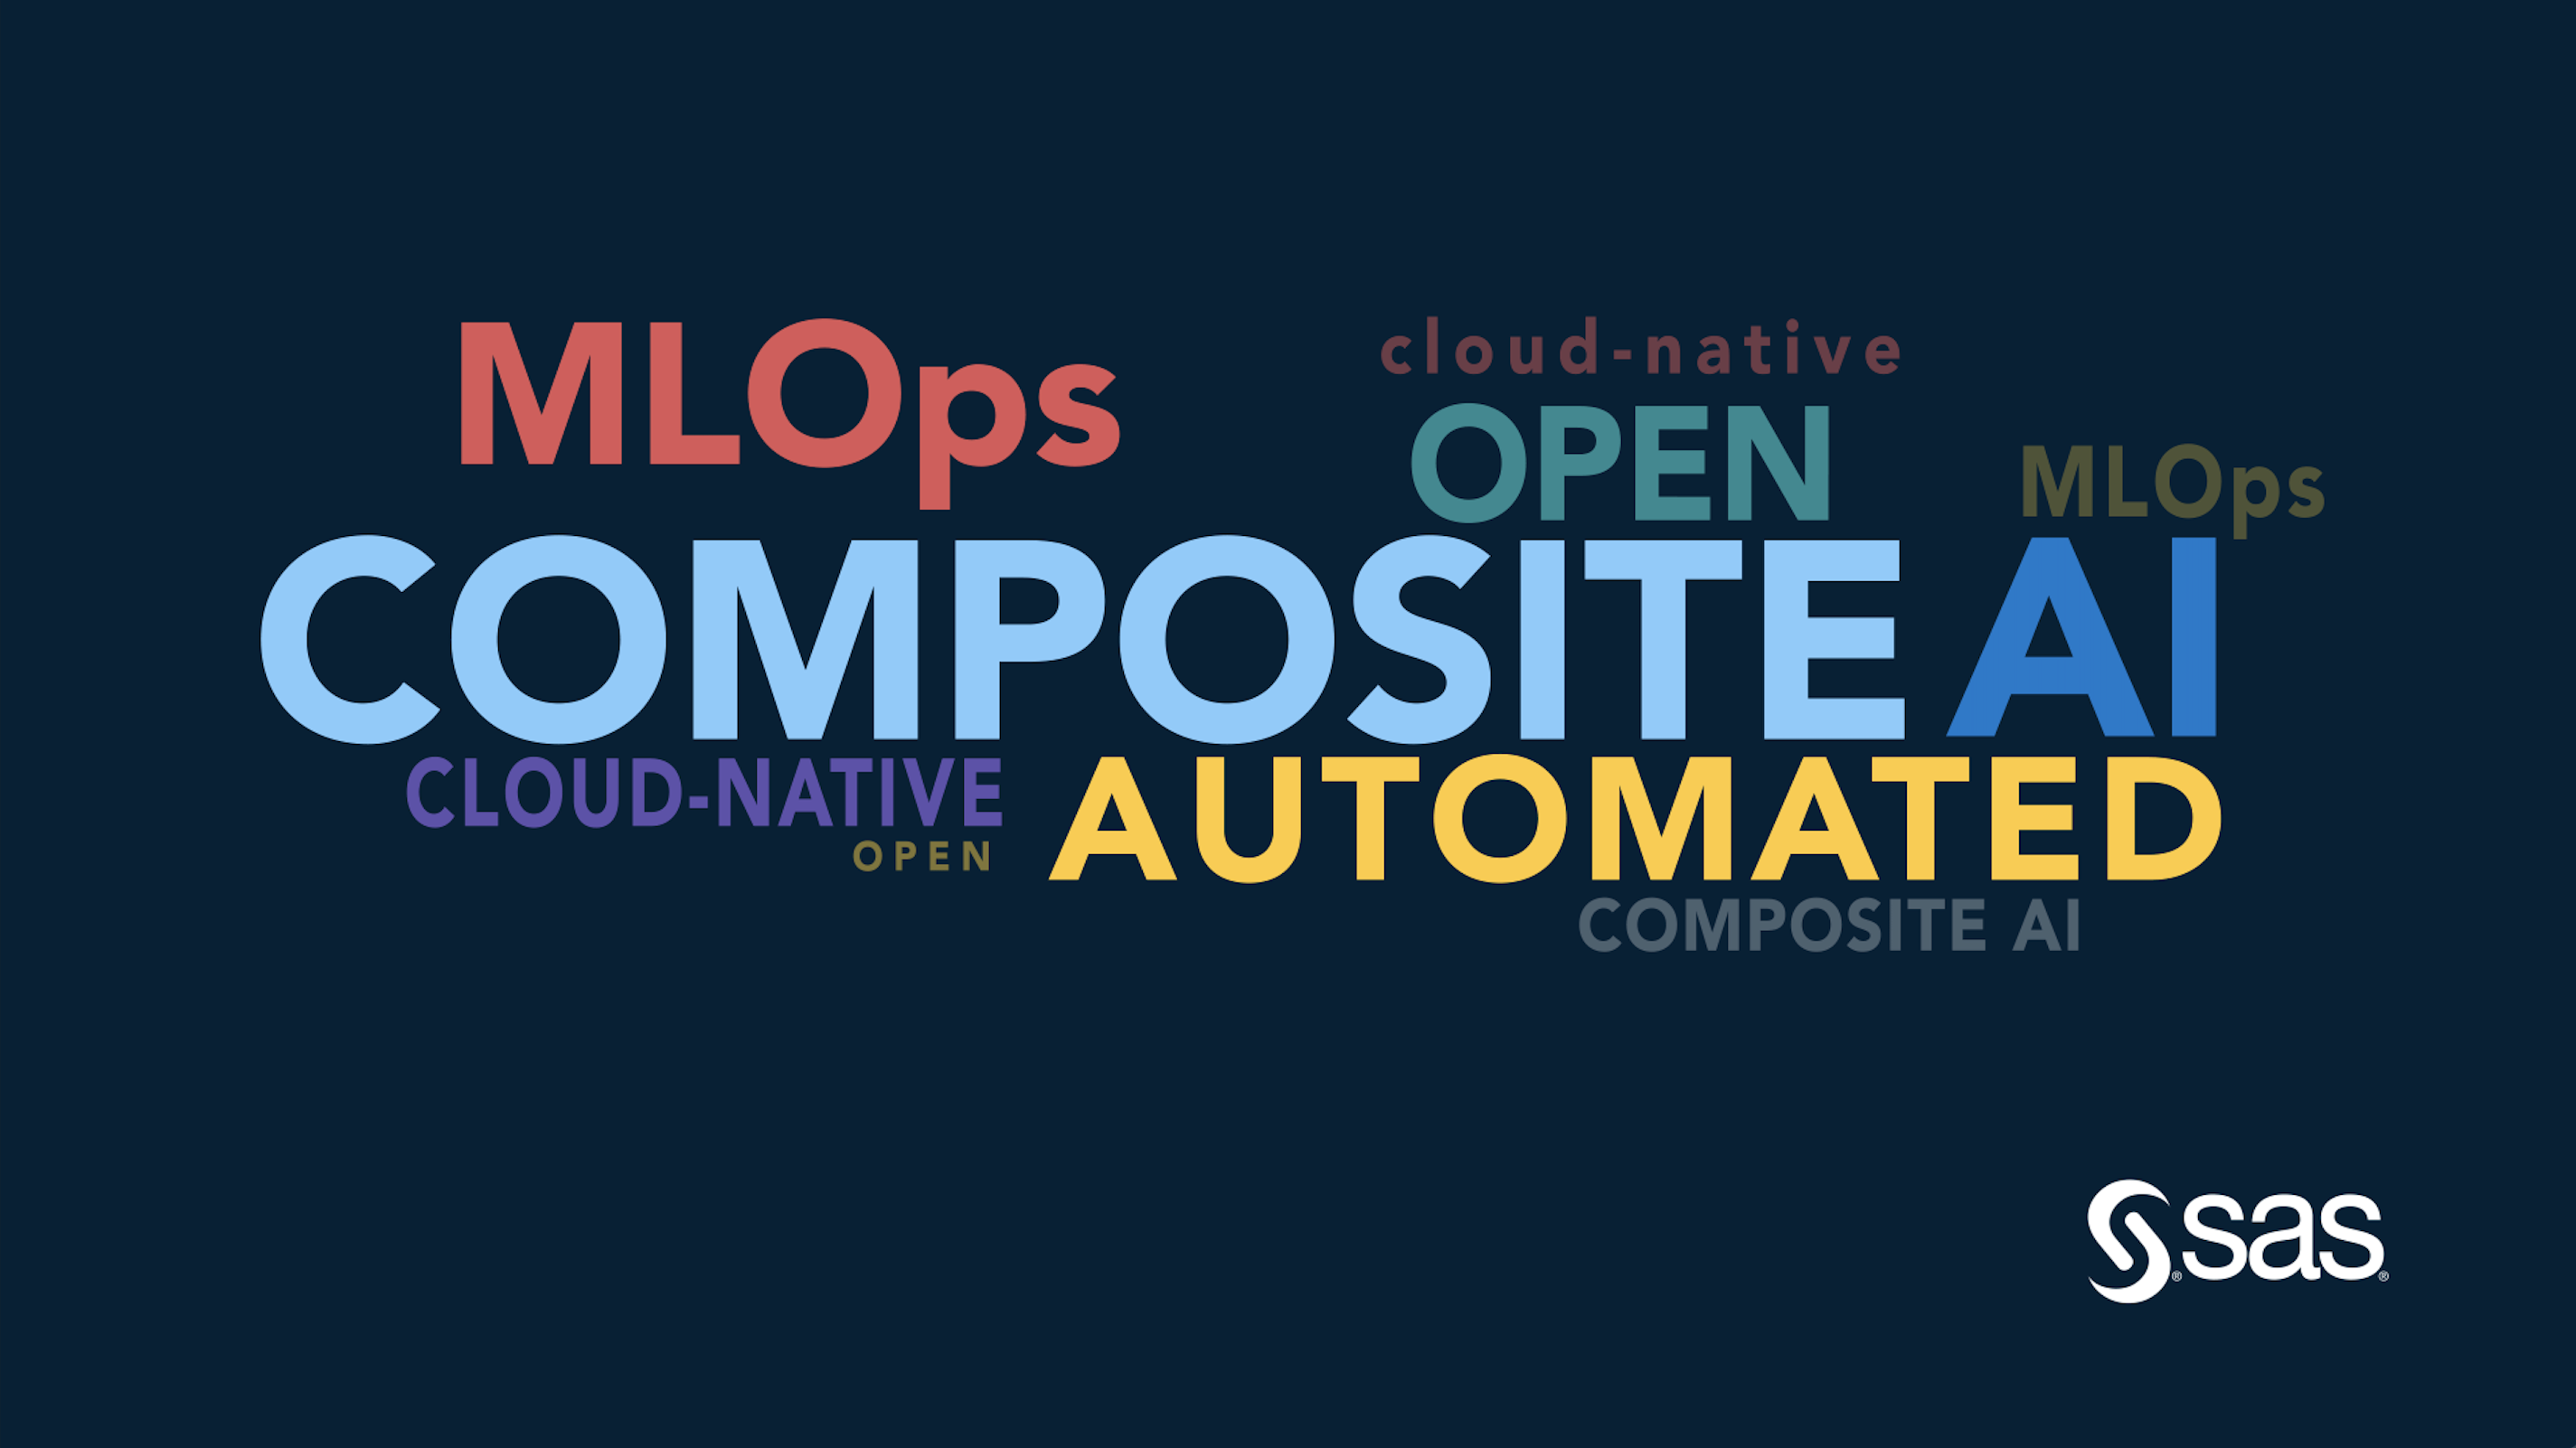
Recently, Microsoft CEO Satya Nadella joined SAS CEO and founder Jim Goodnight for a fireside chat to announce the latest release of the cloud-native SAS® Viya® platform on Microsoft Azure. This new launch was a significant milestone to mark the progress that has been made in our extensive technology and

The recently released 2021 Gartner MQ for Data Science and Machine Learning contains a wealth of information and here are my takes on key market trends from that report for data scientists. This evaluation features SAS Viya with its SAS Data Science offerings.
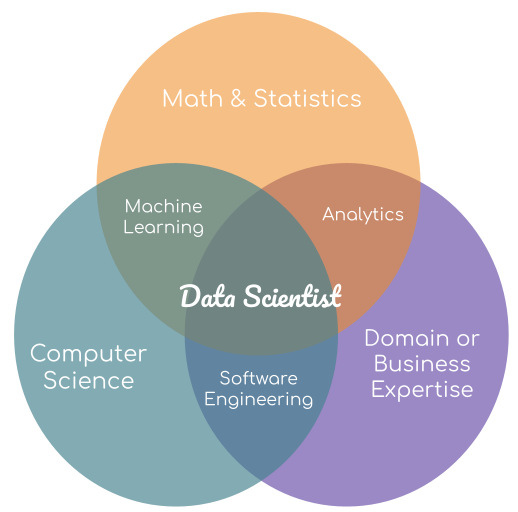

Data scientist has been on the career hot list for years, but how does one become a data scientist? Well, my journey to becoming a data scientist was not an intentional journey - I didn't start with a plan to end up in a data science career. In fact, I


La demanda de profesionales especializados en Ciencia de Datos e Inteligencia Artificial continúa creciendo en las organizaciones y se sitúa entre las 15 profesiones más solicitadas en España para este 2021, según el informe anual de Linkedin “Empleos en auge”. Estas previsiones responden a un espectacular aumento de la demanda


Thanks to COVID-19, companies have experienced how challenging it can be to plan and maneuver their supply chains around an unforeseen disruption. While the pandemic was a once-in-a-lifetime event (we hope), the unfortunate truth is that less severe events have overwhelmed or undermined demand and supply planning in the past


It’s rare that we think this moment is the only moment that matters. We're often thinking about what just happened or filtering through our list of to-dos. These are the things that pull us into what Tara Brach, author of Radical Acceptance, calls the "trance of thinking". It's been really
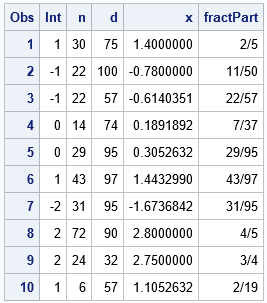
I have previously shown how you can use the FRACTw. format in SAS to display numbers as fractions. But did you know that you can also use the format to obtain the numerator and denominator of the fraction as numbers in a program? All you need to do is to