
One of the most critical tasks banks face in complying with anti-money laundering (AML) regulations involves detecting suspicious activities. Banks rely on AML transaction monitoring systems to scan transactions in search of anything suspicious. Often, these are rules-based systems that look for common money laundering patterns then generate alerts to send human investigators. Investigators determine if the alert is a false positive, or something that needs to be promoted to a case and reported as suspicious.
But money laundering activities are complex. And money launderers routinely attempt to evade detection by creating sophisticated transactional patterns that blend into the crowd of genuine transactions. It's difficult for traditional rules or scenario-based AML transaction monitoring systems to spot these sophisticated data patterns. Compounding the issue, business scenarios that perform well today won’t necessarily perform well tomorrow. As a result, banks see a high volume of false-positive alerts generated by outdated scenarios or valid scenarios running against ever-changing data.
Setting the stage for success: A process to measure business scenario effectiveness
The initial stage of evaluating your AML transaction monitoring system involves understanding how well each of your business scenarios performs. This requires you to define and apply a consistent measure across all business scenarios – which varies from bank to bank. For example, you can define measures as alerts that:
- Are filed as suspicious activity reports (SARs) or suspicious transaction reports (STRs) and confirmed as suspicious by the regulator.
- Are filed as SARs or STRs.
- Have certain disposition codes (e.g., closed as true-positive).
- Required more than X number of hours or days to investigate.
It’s essential for all parties to understand and align to this definition. You'll use it regularly to measure your AML transaction monitoring system performance. With this process in place, you can measure the performance of each of your business scenarios to see how well they perform against real data. Then you can use the results to make better informed decisions. For example, you may decide to:
- Drop the business scenario if it’s obsolete.
- Tune the business scenario if it’s valid but performs poorly due to population changes.
- Refine the rules of the scenario to match changes in money laundering patterns.
- Prioritize your strategy that defines when to fine-tune a business scenario.
Techniques to improve AML transaction monitoring effectiveness
Once you’ve established the process for defining and measuring performance of your business scenarios, you’re ready to apply three techniques to improve the effectiveness of your AML transaction monitoring system. These techniques are:
- Segmentation.
- Threshold setting or tuning.
- Alert hibernation.
Technique 1: Segmentation
Segmentation is a commonly used term – most banks have segmentation models implemented in other parts of the business (such as the marketing department). But the objective of segmentation differs across lines of business – and segmentation models differ as well. So, while you can’t reuse models from other divisions, you can use the same tools and framework. In other words, you may be able to share knowledge and skills as you build segmentation models for AML transaction monitoring.
The objective of a segmentation model for AML is to create homogeneous groups of customers who have similar transaction behaviors or risk profiles. Imagine, for example, that you have a simple business scenario to detect customers who perform large numbers of transactions totaling large amounts.
The problem in implementing this model is that the thresholds “large number” and “large amount” will be different for each type of customer. So, if there were 15 transactions totaling $100 thousand in a month, that might be considered large for an individual. But it could be considered small for corporate customers.
If we use a two-dimensional scatterplot to plot the data of these two types of customers based on the number of transactions in a month and the total transaction amounts, we’ll get a graph similar to the following:
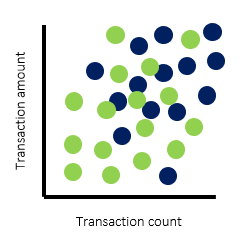
From the graph above, you can see that the clusters of dots for corporate customers (blue) and individual customers (green) cover different areas of the graph. If we segment these customers into groups of homogeneous customers based on their transactional profile, we can set separate thresholds within the AML transaction monitoring system for each segment. You could also define the segmentation strategy from other factors, based on your business expertise and regulatory requirements. For example, you may choose to define segments based on risk profile, occupation, income, etc.
Don’t neglect to validate the accuracy of your data before selecting attributes for the segmentation model. For example, some data that came from “know your customer” (KYC) systems may not be up to date. This could produce undesirable effects in your overall segmentation and transaction monitoring program.
Technique 2: Threshold setting or tuning
Once a segmentation model is in place, it’s time to set the threshold for each of your segments. Threshold settings and tuning methodologies differ from one bank to another. Some may use a simplistic method – such as selecting the threshold based on available workload or selecting X% of the highest transacting customers (a method that’s not favored by regulators). Others use a complex method based on statistical analysis or comprehensive reviews along with analysis.
Consider if this is the first time this threshold will be set. If so, you won’t have population data for the analysis. In this case, you can use an alert sampling to represent the population. A carefully defined data sampling method to determine alert productivity within the population space will be reasonably accurate.
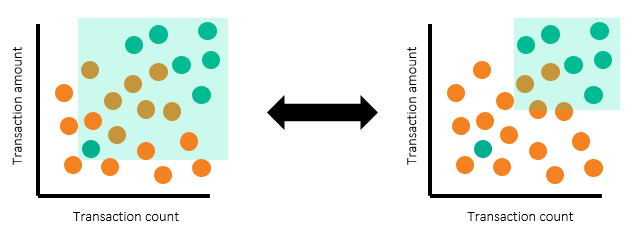
Once alerts and alert disposition data are in place, we can use a scatterplot to illustrate the threshold setting process. Such a scatterplot can differentiate productive alerts from false-positive alerts.
In the following scatterplots, we’ve used turquoise dots to represent productive alerts and orange dots to represent nonproductive alerts. The scatterplots represent each segment and each pair of thresholds. Of course, banks have more than two threshold parameters and segments – which requires multiple scatterplots. But in this example, we’ll use two for simplicity.
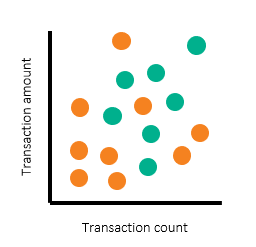
The scatterplots above show alerts by transaction count and amount, with individual customers shown on the left and corporate customers on the right. Note that there are regions where most of the alerts are nonproductive (orange) alerts. There are other regions where large numbers of productive alerts are clustered together. To determine the threshold to set, we’ve drawn rectangular boxes to represent the regions for which we want to have alerts generated.
See the following illustration:
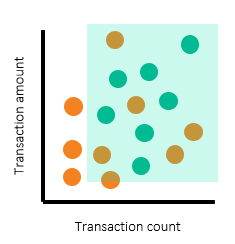
The scatterplots above show the alerting region drawn for both segments. Looking at the rectangular boxes, you can see that turquoise dots (productive alerts) are still not fully separated from the orange dots (nonproductive alerts). The separation is much better when segmentation is in place. You can use segmentation to determine the productivity rate if data is from a production alert that’s in use. Or, you can use segmentation to extrapolate to the estimated productivity rate once the system is in production.
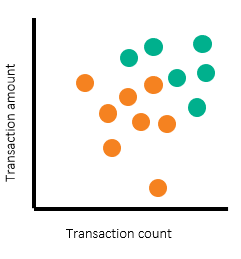
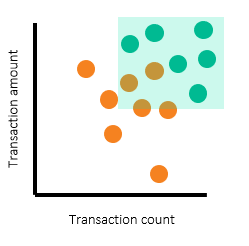
In practice, threshold selection might not be as smooth as this example. It’s not unusual to find a productive alert that is out-of-norm and has much lower threshold values. For example, observe the scatterplots below:
The productive (green) alert that's missed in the example on the right represents a trade-off you’ll make in the threshold selection process. In this trade-off, we're selecting between:
- Choosing productive alert coverage over scenario effectiveness.
- Choosing scenario effectiveness over alert coverage.
On the left, we selected threshold values to cover all productive alerts – so the scenario can detect all productive alerts. But the outlier productive alert (with the lowest threshold values, lower left) will bring down the scenario effectiveness to 41%. On the right, we selected threshold values to have better effectiveness by sacrificing some of the productive alert coverage. In this case, the scenario effectiveness is 75% – and one productive alert is missed.
You’ll need to consider this tradeoff from both a quantitative and qualitative perspective. Before moving ahead, ask an investigator to analyze the productive alert that was missed to make sure it’s a genuine transaction.
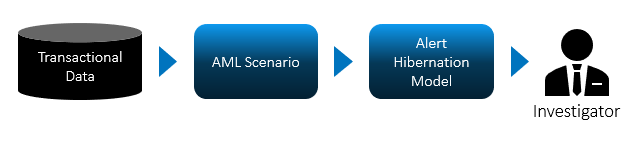
Technique 3: Alert hibernation
The third technique for improving your AML transaction monitoring program involves using predictive modeling. This form of statistical analysis relies on patterns from historical data to make predictions about future events.
In AML transaction monitoring, a predictive model learns by using historical data on alert dispositions from investigators – it attempts to model the pattern investigators take. When this model is established, it can perform alert investigations for you. We call this type of predictive model an alert hibernation model.
Alert hibernation can significantly improve the effectiveness of your AML transaction monitoring program by automatically deprioritizing alerts that are likely to be false positives. For banks, this reduces investigative workload and the investment required from AML program operations. With a lower number of false-positive alerts, investigators can shift their focus to work on more complex money laundering cases – and alerts that are most likely to be money laundering.
Keep in mind that it’s impossible to determine with absolute certainty whether a transaction is money laundering or genuine. Factors that play into such determinations are influenced by:
- Subjectivity of the individual investigator.
- The investigator’s expertise.
- Available information.
- The investigator’s familiarity with the customer.
In practice, banks use predictive models to close (or hibernate) alerts that are very likely to be false-positive.
Remember: Keep monitoring model performance
Under the hood, alert hibernation models examine various attributes – like those investigators use to make decisions. The predictive model learns from historical alert disposition data and decides which attributes are good predictors of productive versus false-positive alerts. You can also adjust the trade-off in the model. Basically, this means you can adjust the potential number of false positives you reduce in relation to the likelihood of missing a productive alert.
Remember that the work is not done after your model is deployed. You’ll want to continue to monitor the performance of your model. First, you’ll need to make sure you got the expected results when the model was first used. And you’ll need to monitor the model routinely so that you can act as soon as model performance starts to degrade. Regulators typically require an annual review of the model to ensure it’s still valid.
Learn how SAS helps financial institutions improve their AML programs


2 Comments
Hello Nuth,
Thankyou for providing this helpful information it is easy to get the things with the help of graphics which u had used with information regarding AML transaction monitoring.
Hi Smith,
Glad you find it useful!