All Posts
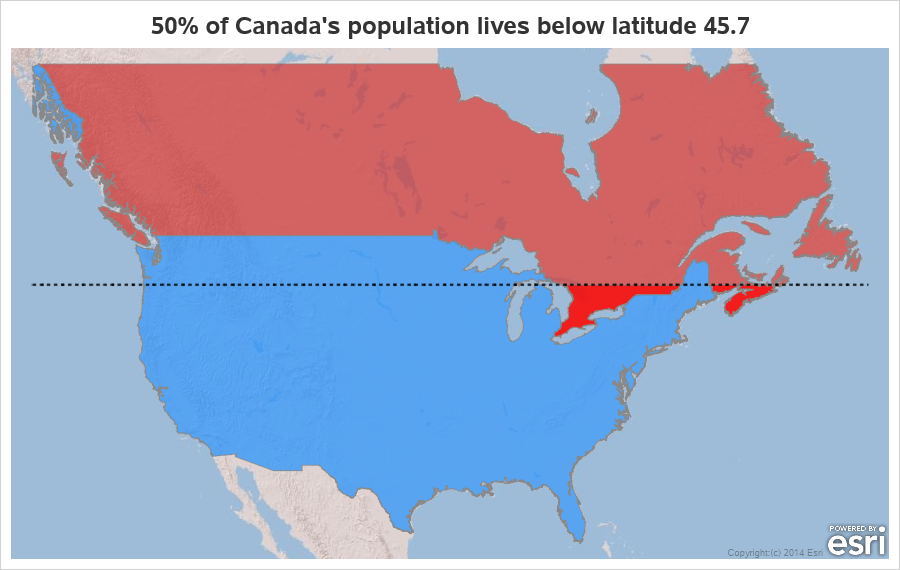

Canada is a geographically large country, but I've heard that much of the population lives in the small southernmost sections (near the US border). I decided to use my mapping skills, and put that to the test. Follow along, and we'll see what that looks like on a map ...
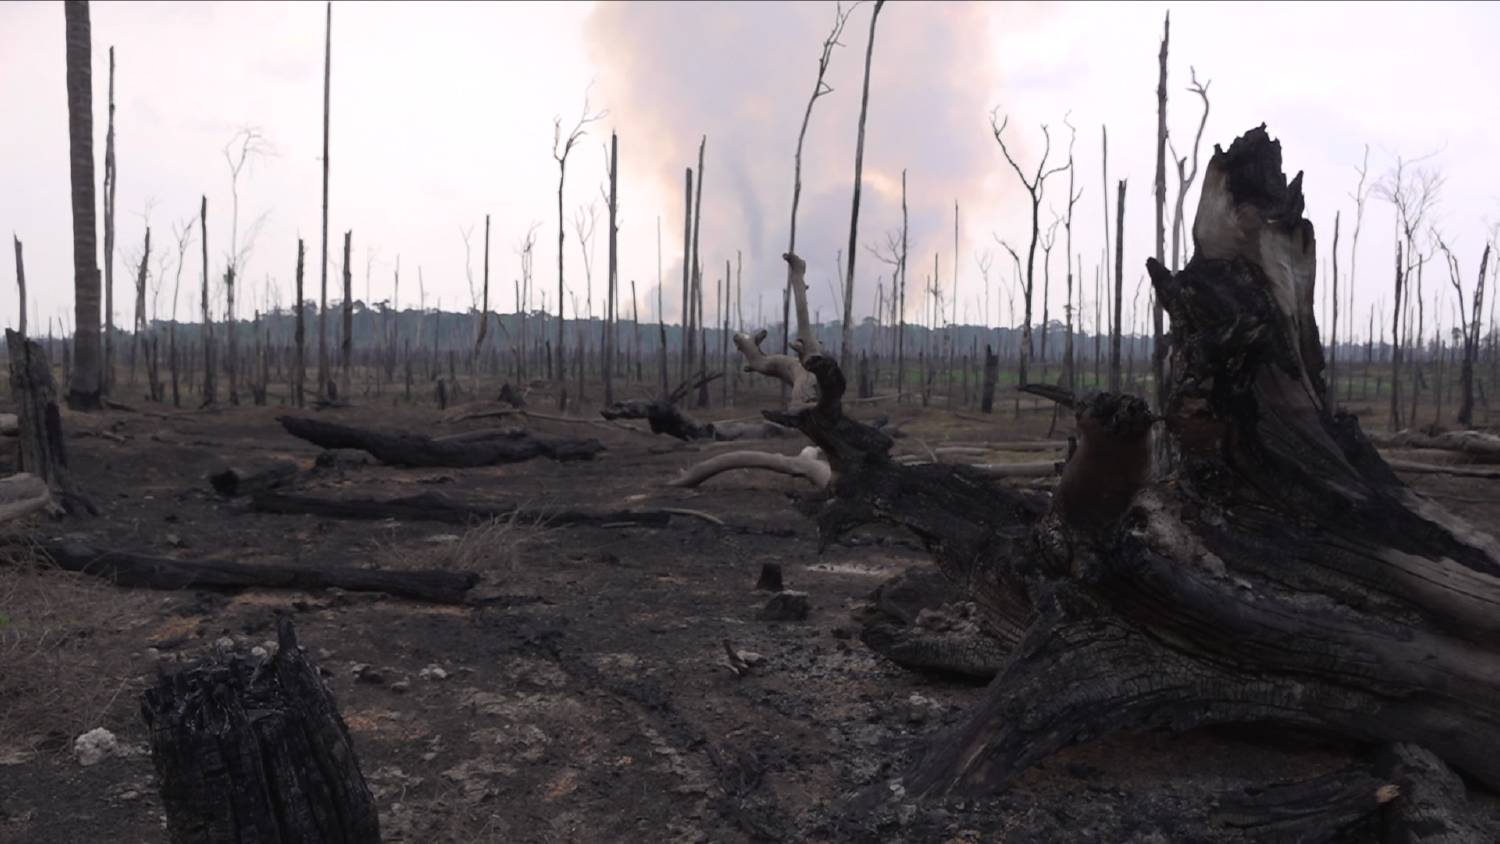

The Amazon rainforest is the largest rainforest on our planet. Nowhere else in the world can we find more animal and plant species. Unfortunately, we lose on average 800 square kilometres of forest every day to deforestation for logging, agriculture or road construction. But there is still hope for our
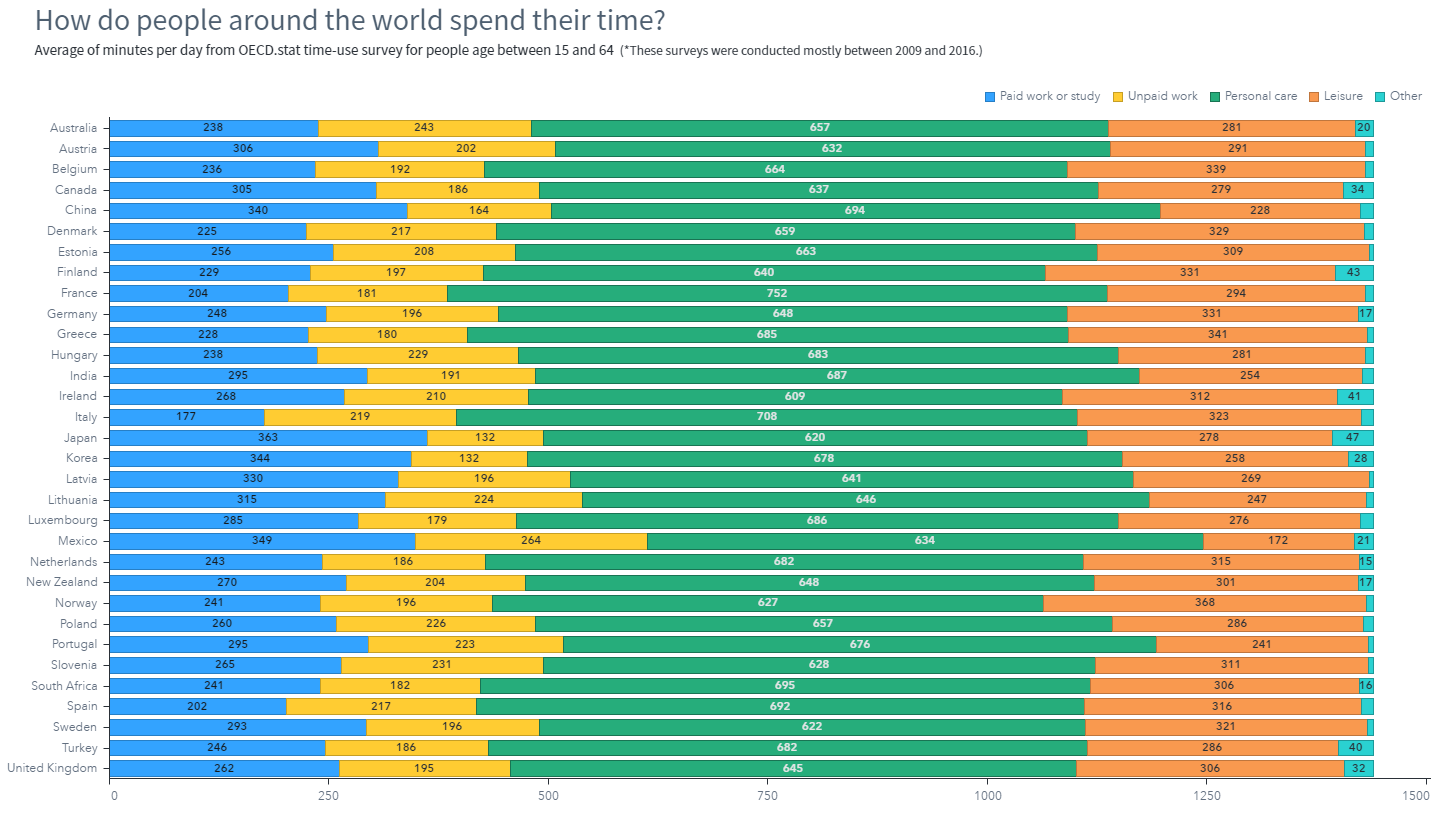

SAS' Cindy Wang uses SAS Visual Analytics to explore how people around the world spend their days.


Do you have a love/hate relationship with cruciferous vegetables? You love eating them, but your gut hates digesting them? Or you can’t stand the bitter flavor, but you would love to get the health benefits from eating them? Whether it’s your taste buds or your belly that has a crucifer
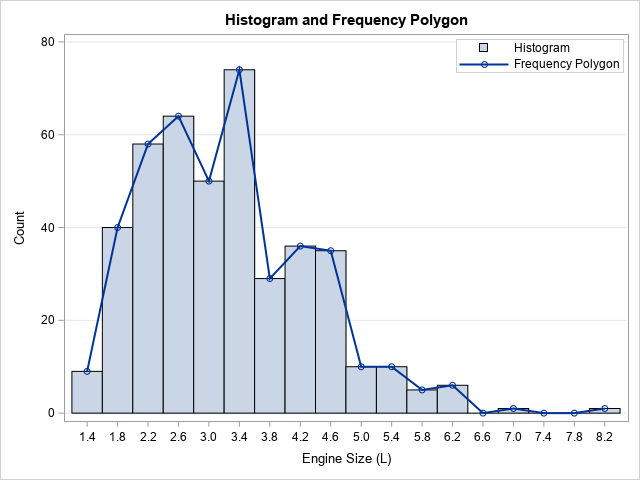

I was recently asked how to create a frequency polygon in SAS. A frequency polygon is an alternative to a histogram that shows similar information about the distribution of univariate data. It is the piecewise linear curve formed by connecting the midpoints of the tops of the bins. The graph


If you are thinking that nobody in their right mind would implement a Calculator API Service with a machine learning model, then yes, you’re probably right. But considering curiosity is in my DNA, it sometimes works this way and machine learning is fun. I have challenged myself to do it,


Analytics offers huge potential to transform raw data into operational intelligence. It provides new insights into old or new problems. This is crucial in business – but it is even more important for tackling big societal issues, such as domestic violence or human trafficking. I recently had the opportunity to


Multiple burglaries were reported over a three-week span in a specific area of Delaware. Delaware State Police used their institutional knowledge augmented by analytics and were able to bust the burglary ring after matching surveillance footage and public records to an address and photo description. In the past, the only option


The process changes that are taking place in the insurance world are massive. More and more insurance companies allow for remote sales of life products and entire sales processes have been simplified for the benefit of the customer. However, opportunities for abuse arose with them as well. A simpler process
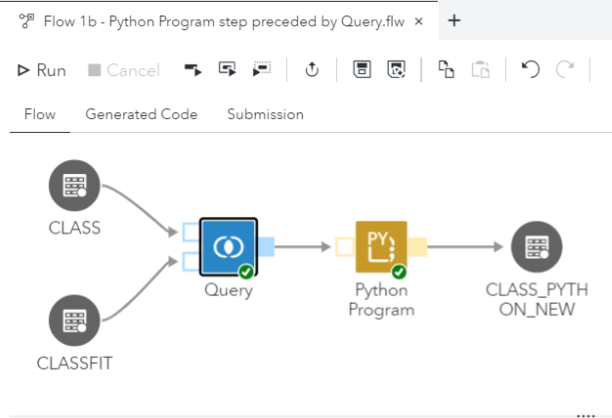

[Editor's note: this post was co-authored by Marinela Profi and Wilbram Hazejager] Data science teams are multidisciplinary, each with different skills and technologies of choice. Some of them use SAS, others may have analytical assets already built in Python or R. Let's just say each team is unique. As part


"According to Gartner, “over 50% of senior marketing leaders are unimpressed with the results they receive from marketing analytics investments” – yet most companies expect to increase these investments over the next few years. How can we avoid throwing good money after bad?" By Oliver Sheerin, Senior Customer Intelligence Advisor, SAS. When
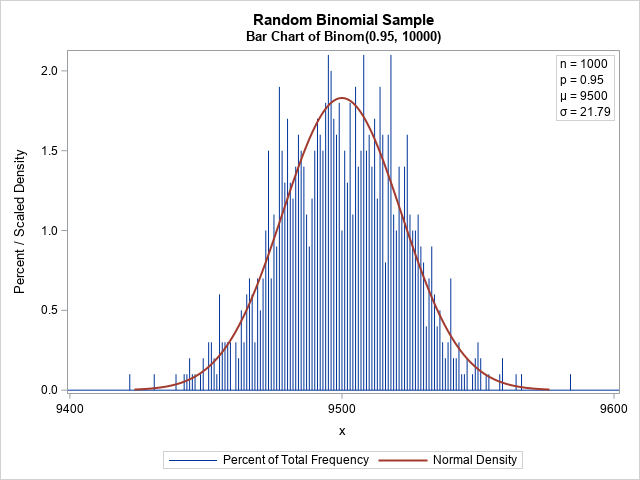
Recall that the binomial distribution is the distribution of the number of successes in a set of independent Bernoulli trials, each having the same probability of success. Most introductory statistics textbooks discuss the approximation of the binomial distribution by the normal distribution. The graph to the right shows that the


En varios de los países latinoamericanos, los gobiernos nacionales y departamentales han venido presentando diversas agencias analíticas y nuevos centros de monitoreo especializados en estas últimas semanas. Esta es una muestra más de cómo lo ocurrido en este último tiempo ha hecho que se tenga mucho más presente la inteligencia


Uma das profissões mais cobiçadas e bem remuneradas atualmente é a de Cientista de Dados. Grandes empresas de telecomunicações, instituições financeiras e redes de varejo estão formando times com estes profissionais, e o movimento não é restrito às grandes corporações. Empresas médias também estão sedentas em busca de cientista de


In my previous article, “The Vital Ingredients of Responsible AI,” I described the principles that underpin the need to develop AI systems that factor in the human factor, not only contribute to business outcomes but also protect individuals, society and the environment. While it’s difficult to argue with those principles,