All Posts
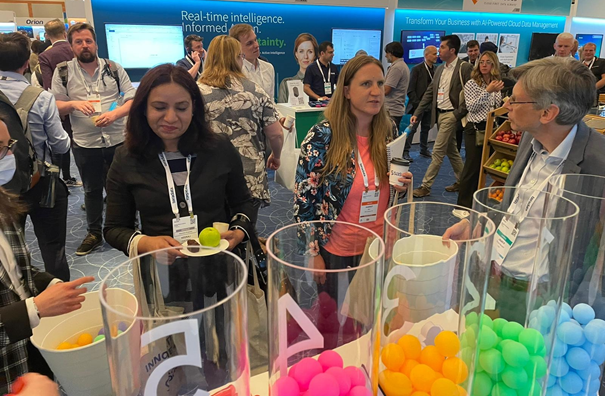

After two years of virtual events we finally got the chance to attend (an in-person event at) the Gartner Data & AI Summit that took place in London. Keen to take advantage of the combined knowledge and experience of the +1500 attendees, we decided to ask them a question at


Self-care is something we should all do on a daily basis. It's good for the body, mind and spirit. While we have a plethora of breathing and meditation audios in our SAS RFC gallery, apps are great too. In this article, I’m sharing six free meditation apps that can assist

A common question on SAS discussion forums is how to randomly assign observations to groups. An application of this problem is assigning patients to cohorts in a clinical trial. For example, you might have 137 patients that you want to randomly assign to three groups: a control group, a group
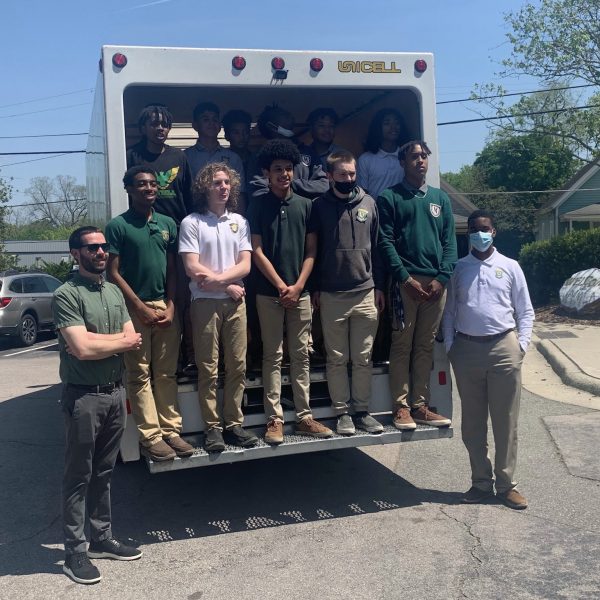

Six scholars from North Carolina A&T State University in technology– or STEM-focused majors helped foster the next generation of data-literate students while also donating to those in need. SAS recently facilitated a donation drive with students from the Wake County Young Men's Leadership Academy (WYMLA) in Raleigh, North Carolina and scholars from


If you use formatted variables in a CLASS statement in procedures such as MEANS or UNIVARIATE, SAS will use the formatted values of those variables and not the internal values. For example, consider you have a data set (Health) with variables Subj, Age, Weight, and Height. You want to see


A delegation of 26 members of the American Chambers of Commerce of the European Union (AmCham EU) made their way to the Research Triangle. Representatives learned about local methods and best practices for developing the American economy and locating potential business partners. Leaders from countries across Europe first met with


They look the same, don’t they? It can be hard to tell one duck from another, but one of them is from a bad egg (I’ll tell you which one at the end of the article). Business rules are a bit like this. They find you lots of alerts, but


One of the most exciting aspects of working at SAS is seeing #Data4Good projects come together. For example, SAS is an official analytics supplier to the Special Olympics, part of the inclusion movement for people with intellectual disabilities. For the 2019 edition of the Special Olympics, we brought together a


Poseer la información adecuada en el momento preciso puede ser determinante en la resolución de un delito. Es por eso que una gestión de los datos que permita extraer de ellos el máximo valor se ha convertido en un aspecto fundamental para el sector de la Seguridad Pública. Información en
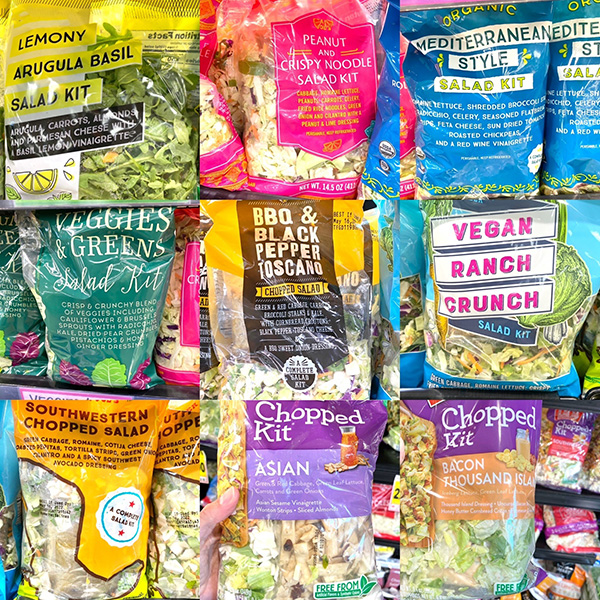

Salad kits have become very popular over the last few years, and for good reason. Most of us are trying to eat healthier and they make it easier. Right? Not so fast. Not all salad kits are created equal. In fact, some of them can be loaded with added sugars,
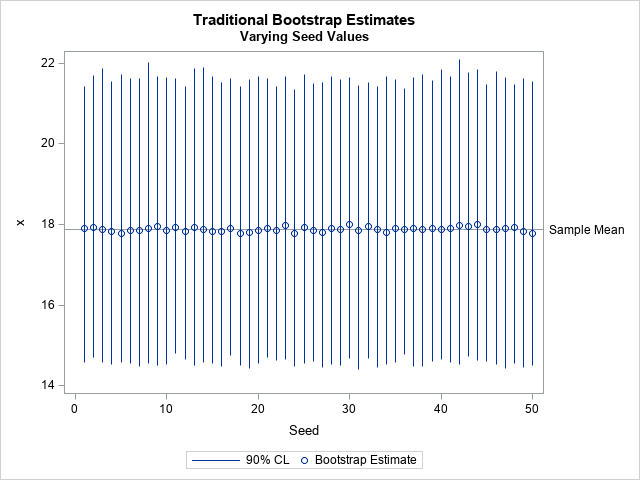
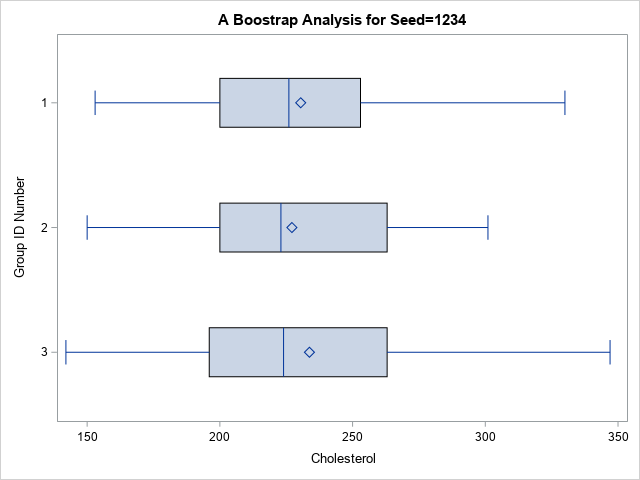
Many modern statistical techniques incorporate randomness: simulation, bootstrapping, random forests, and so forth. To use the technique, you need to specify a seed value, which determines pseudorandom numbers that are used in the algorithm. Consequently, the seed value also determines the results of the algorithm. In theory, if you know

Industrias y organizaciones que aceleraron varios años sus procesos de transformación digital, tendencias phygital que combinan y aprovechan los escenarios físicos y digitales para adaptarse mejor a los nuevos requerimientos de los clientes y consumidores cada vez más empoderados. Estos son algunos de los elementos que están configurando la nueva
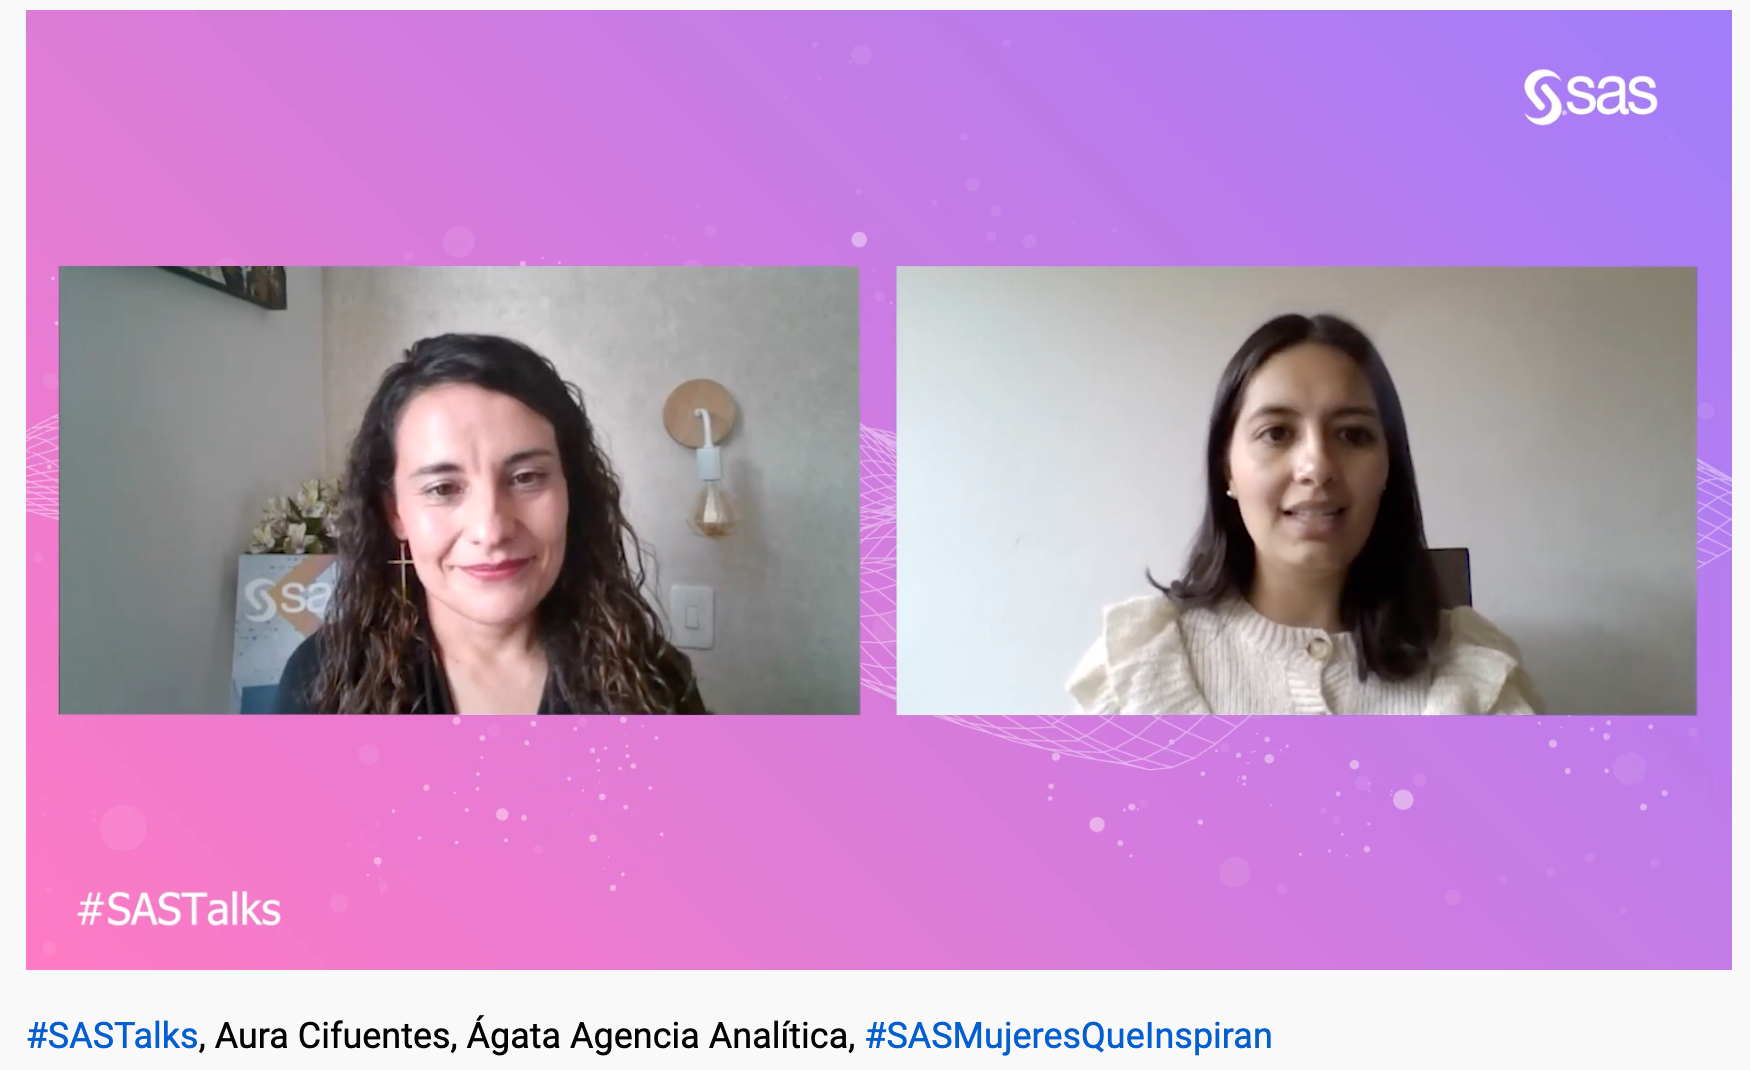

“Impulsar la toma de decisiones basadas en datos y generar soluciones para transformar sociedades y mejorar la calidad de vida de las personas con el apoyo de la analítica”. Esta es la misión con la que fue creada hace tan solo 2 años y en plena pandemia la agencia oficial


Higher education institutions are some of the most data-rich entities in the world. Postsecondary leaders need high-quality, consistent and accurate insights to make the best decisions for their institution, students and constituents. Data governance is a topic that may seem technical in nature and perhaps important to only the IT


As a former police commissioner, I can testify that public-sector fraud is a global problem. Government fraud is becoming bigger and more dangerous every year, especially in the COVID-19 era. Governments view the pandemic as a public health emergency and a severe threat to economic stability. But it’s also important