
Outliers provide much-needed insights into the actual relationships that influence the demand for products in the marketplace. They are particularly useful when modeling consumer behavior where abnormalities are common occurrences or unforeseen disruptions that impact consumer demand.
But why do demand planners cleanse out outliers, when many are not really outliers?

The problem with discarding such anomalies is many people think that they are improving the integrity of historical data by averaging them out. Instead, they are discarding valuable information that can be used to uncover insights otherwise overlooked.
What is an outlier?
True outliers are a result of data entry errors or a mistake in coding. These outliers are classified as problematic, not representative of the population and they are counter to the objectives of the analysis. Problematic outliers can seriously distort the statistical results of the model affecting the structural integrity of the statistical parameters.
All outliers are categorized as problematic by many demand planners and are treated accordingly — eliminated from all data completely. These demand planners assume that all experienced statisticians follow the same thought process regarding the elimination of outliers. The truth of the matter is that most outliers fall into the category of extraordinary events (or responses) like sales promotions or unforeseen short-term disruptions that experienced statisticians refer to as “influential observations,” or exogenous variables.
Statistical modeling can sometimes be affected greatly by one or more of the observations. Since influential observations can have such a dramatic effect on the estimated model equation, it is important that they be examined carefully through several techniques — scatter plots and statistical diagnostics.
Incorporating outliers into demand planning
First, ensure that no errors have been made in collecting or recording the data. The historical data can be corrected if there has been an error and a new estimated predictive model implemented. On the other hand, if the observation is valid, we should consider ourselves fortunate we have them. Such a point can contribute to a better understanding of the appropriate model and can lead to a better estimated future prediction.
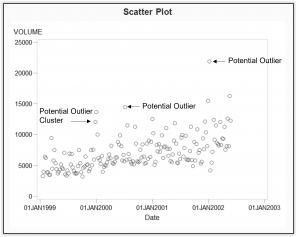
Outliers should never be discarded or averaged out of the data being examined, according to some statisticians. Many influential observations can “not” be detected by a scatter plot or other graphs as they may be buried in the data requiring more sophisticated statistical diagnostic tests designed to detect outliers. It is most important not to eliminate clusters (or groupings) of influential observations, as they are usually high leverage points. (See Figure 1.)
Large, standardized observation residuals and high leverage points can be identified statistically by "automatic outlier detection." These observations should be carefully examined for validity and to determine whether they have an impact on the estimated predictive model.
Intervention variables are an additional modeling technique that captures the impact on demand or adjusts demand history without removing data. By uncovering and including influential observations, the model becomes more meaningful (or a better representative of the population it is modeling), as well as more accurate in its future predictions.
Automatic outlier detection
Automatic outlier detection is the process of using analytics to detect outliers or a data point that is far away from the average. In this case, automatically adjusting the historical data or resolving outliers from the analysis to prevent any skewing of results. Outlier detection is time-consuming and a repetitive non-value-add process. Demand planners must manage this with the intention of improving the quality and reliability of the historical demand data.
Unfortunately, most demand management technology cannot automatically detect outliers, let alone correct the historical data. As a result, demand planners spend a large portion of their time every forecasting cycle manually cleansing the historical data. Outliers can indicate failures in data collection, but in many instances, they could be an event of interest. Examples include a sudden emerging disruption like lost demand due to lack of inventory and/or an abnormal spike in demand caused by a promotion.
Why automatic outlier detection is important
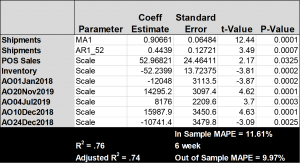
A few years ago, we worked with a large consumer products company conducting a proof-of-concept and found several outliers using automatic outlier detection (see Table 1). The marketing team immediately confirmed that several outliers were promotions (November 2019, July 2019 and December 2018), while the remaining outliers were related to out-of-stock items (December and January 2018).
We re-tagged outliers with the appropriate promotion name. We then asked the marketing team if they were planning to run those same promotions again in the following year. Two negative outliers automatically adjusted the historical demand for the out-of-stock items.
The marketing event calendar identified when the promotions were being deployed during different time periods. We turned them on in those future periods to replicate the promotion lifts and effectively predicted the increase in demand. Data cleansing was not required.
This example shows how outliers can be used to improve results instead of being automatically ignored.
For more information go to SAS for Predict & Plan Consumer Demand.

2 Comments
Thanks Charlie, for emphasizing the difference between incorrect data points (that should be removed) and extreme (but legitimate) data points that reveal the inconvenient truth that demand behavior can be a lot crazier than we'd like. Removing (or even "smoothing" these legitimate extremes to more moderate levels) is a terrible practice that ignores the true volatility of demand patterns. Sure, we can get nicer behaving forecasts by removing the extremes -- and everyone wishes the future will be well-behaved. But bad / crazy things have happened in the past, and will almost surely happen again in the future. So we might as well face the reality and prepare our organizations to be able to handle whatever the future hands us.
Hi Mike,
Like always your comments and input are thoughtful and insightful. Your knowledge and experience are greatly appreciated. Thank you for responding to this article and providing your perspective. You have an accurate and deep understanding through your practice experiences that validates the content. Thank you.
Charlie