All Posts

SAS' Kevin Russell compares how you order your data with a BY statement in SAS 9.4 versus in CAS using the ADDROWID data set option in SAS Viya.
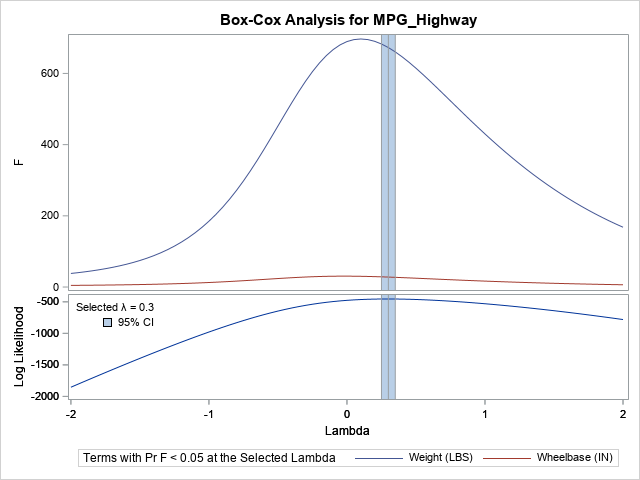

In the 1960s and '70s, before nonparametric regression methods became widely available, it was common to apply a nonlinear transformation to the dependent variable before fitting a linear regression model. This is still done today, with the most common transformation being a logarithmic transformation of the dependent variable, which fits


In March 2020, when nearly all schools closed due to the COVID-19 pandemic, most school leaders would never have anticipated the speed or length of school closures, nor the magnitude of its impact on students and educators. As state departments of education and local school districts continue to take measures


SAS has been busy this summer and so has Women in Analytics (WIA). Read through this list to learn something new, discover upcoming events and see what WIA has been up to! Batting Lab With the recent opening of the SAS Batting Lab, kids are learning how to improve
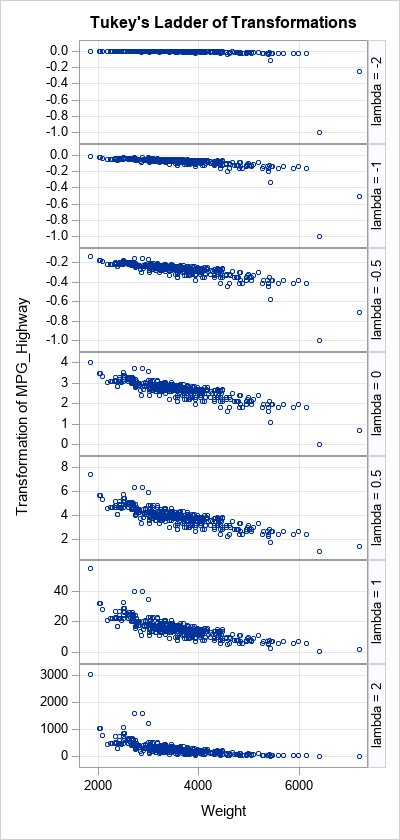
John Tukey was an influential statistician who proposed many statistical concepts. In the 1960s and 70s, he was fundamental in the discovery and exposition of robust statistical methods, and he was an ardent proponent of exploratory data analysis (EDA). In his 1977 book, Exploratory Data Analysis, he discussed a small


Let's create a Multi-stage Computer Vision model to detect objects on high-resolution imagery taken from an aerial view. The goal is to locate a dog and determine if he is wearing a scarf or not and what color the scarf is.


야구에 데이터를 더한다면 어떤 효과가 일어날까요? 야구 실력도, 데이터 활용 능력도 향상시켜줄 어린이를 위한 데이터 리터러시 프로그램, SAS ‘배팅 랩’을 소개합니다. 전 세계적으로 7,000명 이상의 경영진을 대상으로 진행한 한 설문조사에 따르면 85%가 미래에는 데이터 활용 능력이 오늘날 컴퓨터 사용 능력만큼 더욱 중요해질 것[1]이라고 답했습니다. 반면, 48%의 어린이는 현재 교육 과정이 데이터


It’s back to school season, so we thought it’d be a great time to refresh on the basics, like the ABCs. ;) Because at SAS, we believe in providing an exceptional employee experience, all the way from A to Z! Check out the ABCs of the #saslife. A is for…Art


Across all industries and sectors, the volume and scope of data continues to increase exponentially. It shows no sign of slowing down or reducing. UK Defence, and the wider public sector, collect vast amounts of data. They have a desire to innovate and exploit that data through analytics, artificial intelligence,


Maybe you’re a SAS®9 programmer in the insurance industry who stores her analytics projects in a local desktop folder, or in a Git library. Or maybe you’re a data scientist who specializes in aviation forecasting and loves the no-code environment of SAS® Viya®. Or maybe you’re a Python devotee at


A comienzos de los años 90’s William J. Bratton, entonces jefe de la Policía de Nueva York (NYPD), introdujo el primer sistema de analítica de datos estadísticos de actividad criminal denominado COMPSTAT (acrónimo para COMPuter STATistics). Un sistema revolucionario ya que, por primera vez, se registraban y comparaban datos temporales
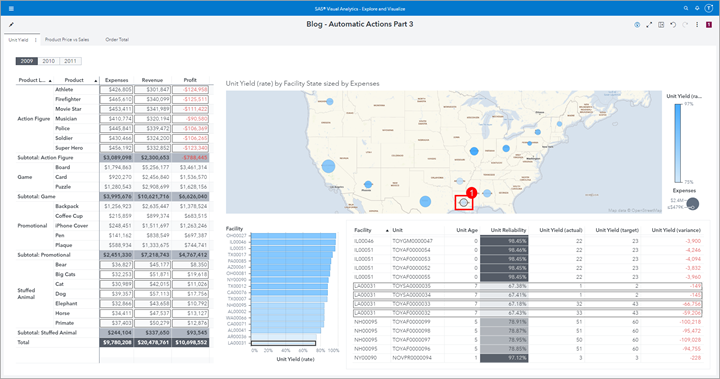

If you haven't explored data with Automatic Actions enabled yet, then read on to learn about some fast and easy ways to gain insights using One-way filters, Two-way filters or Linked Selection! Part 1 – Easy exploration for multiple data sources In this post, we focus on One-way filters. Here


One thing I hear from the majority of my patients is the need for quick and easy dinner ideas. Weeknights are busy, I hear you! To get healthy, real, whole food based meals on the table quick, some planning ahead is key. There is no way you can get a


Customer acquisition and retention primarily fall on sales and marketing teams. But every department within an insurance company has a role to play in these activities. Claims handling is a great example. Any insurer's performance at this emotionally charged time is their litmus test. It can determine whether customers renew


It’s hard to get through a day in analytics now without hearing the words interpretability and explainability. These terms have become important in a world where machine learning and artificial intelligence (AI) models are becoming more ubiquitous. However, what do the two terms mean—and more importantly, why do they matter?