Our blog editor extraordinaire Shelly Goodin brings you tips and information on technical content from our books that you can use immediately in your work. But what if you’re not there yet? What if you want to start with a 50,000-foot level view of analytics overall? Or learn how forecasting
Search Results: ODS Excel (303)

As the International Year of Statistics comes to a close, I've been reflecting on the role statistics plays in our modern society. Of course, statistics provides estimates, forecasts, and the like, but to me the great contribution of statistics is that it enables us to deal with uncertainty in a

As the “Year of Statistics” comes to a close, I write this blog in support of the many statisticians who carefully fulfil their analysis tasks day by day, and to defend what may appear to be demanding behavior when it comes to data requirements. How do statisticians get this reputation? Are we

This is a continuing topic of the SAS Administration and Performance blog series. In the last edition, I discussed why you need to do a technical assessment prior to planning your SAS deployment. Yes, this step takes time, but you’ll find it far easier to implement the suggested tuning guidelines

The No. 1 retail trend for 2014 will be innovation powered by advanced analytics. Why? Because retailers with the ability to surface and validate new ideas from customer data will be able to test new ideas faster, launch them faster in stores, and roll out profitable programs faster. Transformation today

With the others, I filed into the school gymnasium, my super zoom camera lens at the ready and a nervous smile on my face. Across the room, I caught a glimpse of my unsmiling daughter, and my apprehension grew about how this awards day program would play out for her.
If you're a student or young professional, you're in luck! I've compiled a cheat-sheet of the grants, scholarships and mentorship programs offered at SAS Users Group conferences. Why attend a conference in the first place? Simple. You can increase your SAS knowledge, network with experienced SAS professionals and generally improve

Fall is rolling around, which means time to plan and attend at least SAS regional conferences. I’m heading to the Southeastern SAS User’s Group (SESUG) conference in beautiful St. Petersburg, Florida. While I do love the conference, they had me at St. Pete Beach!
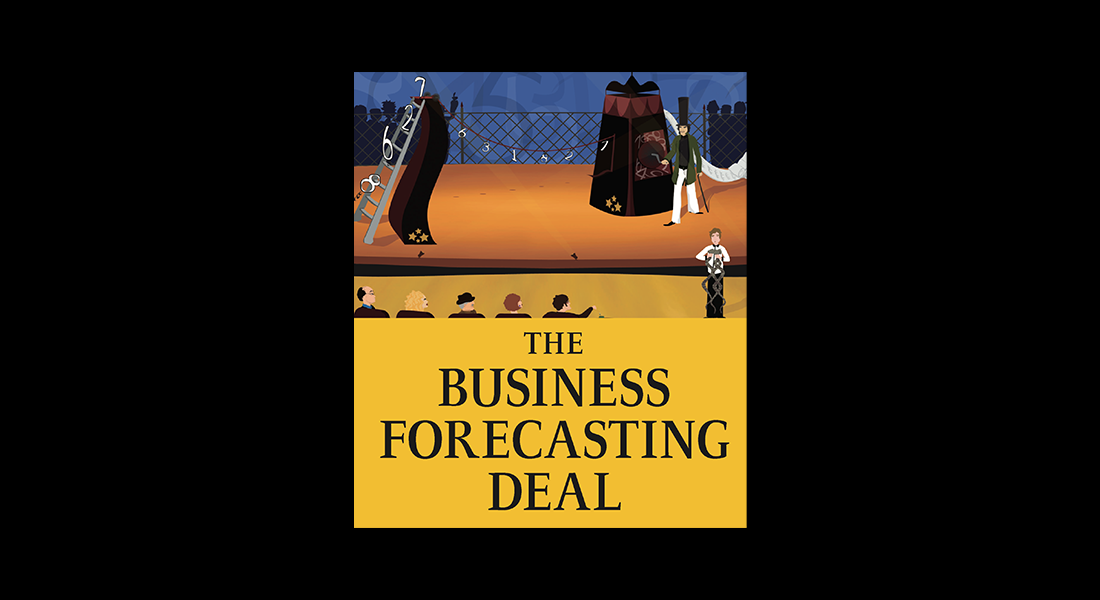
"Forecastability" is a frequent topic of discussion on The BFD, and an essential consideration when evaluating the effectiveness of any forecasting process. A major critique of forecasting benchmarks is that they fail to take forecastability into consideration: An organization with "best in class" forecast accuracy may do so only because

How do you like your sandwich? On rye, whole wheat or white bread? What fillings and dressings do you like? You probably think I’ve gone completely crazy and I don’t blame you. What does food have to do with SAS, you say? Loads -- as you’ll find out with this

Mercifully, we have reached the final installment of Q&A from the June 20 Foresight-SAS webinar, "Forecast Value Added: A Reality Check on Forecasting Practices." As a reminder, a recording of the webinar is available for on-demand review, and the Foresight article (upon which the webinar was based) is available for free
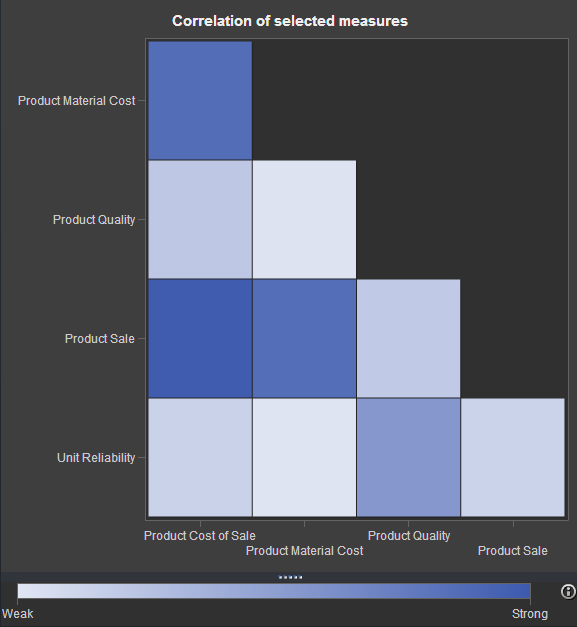
If you've watched any of the demos for SAS Visual Analytics (or even tried it yourself!), you have probably seen this nifty exploration of multiple measures. It's a way to look at how multiple measures are correlated with one another, using a diagonal heat map chart. The "stronger" the color
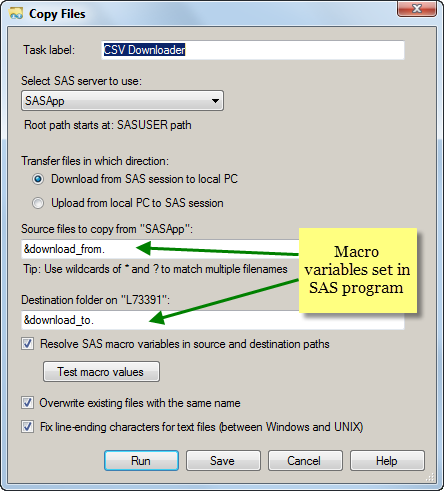
Last week I alluded to some very useful applications of the Copy Files task. This is one of them. If you have SAS Enterprise Guide 7.13 or later, the Copy Files task is in the Tasks->Data menu. In earlier versions, you'll have to download/install the task as a custom task.
When I told a friend that the title of my new book is Simulating Data with SAS, she asked, “Why would anyone want to simulate data?” To her, data are measured or surveyed. Data tell us how big, how often, and how many. Data indicate people’s opinions about politics and

Today is Diabetes Alert Day. The purpose of Diabetes Alert Day is to bring attention to the rising incidence of diabetes in the US and to alert folks to take action NOW to prevent or delay the onset of Type 2 diabetes. Preventing diabetes equates to blood glucose management which

“Speak and you shall be heard.” Well… our students spoke, and we listened! SAS Education is always striving to improve the training we deliver, and one of the most important ways we do this is by taking the time to listen to our students. Over the past several months, our
SG procedures and GTL use a collision avoidance algorithm to position data labels for a scatter or series plot. This is enabled by default. The label is preferably placed at the top right corner of the marker. The label is moved to one of the eight locations around the marker to
Last week I delivered a SAS Talks session: Introduction to Custom Tasks for SAS Enterprise Guide (click to watch it). I promised that I would share a collection of resources where you can learn more information. First, here is a round-up of the custom tasks that I mentioned, with links

One purpose of this International Year of Statistics is to spread the word that the field of statistics benefits society. As part of the International Year, many organizations, including SAS and the American Statistical Association (ASA), are turning to history to illustrate how statistics is vital to the health and

Over the holidays I was having a discussion with my cat, Ms. Trixie Lou. A question that often arises during the first programming class is the following: how do I find the variables that are in common to these two or three data sets? As it turns out, Ms. Trixie

Many of my blogging colleagues are taking this week to reflect on their top posts in 2012. Some are using the visitor statistics to rank the posts, but as Andy Ratcliffe points out, that gives short-shrift to the late-season articles. This year, I'm going to use this space to recap

The Lancaster Centre for Forecasting is led by two of my favorites in the forecasting world, Robert Fildes and Sven Crone. The Centre is home to cutting edge research and consulting, covering the range of forecasting models and methods, as well as real-world forecasting process. The Centre has announced a
Last week I attended my first SCSUG conference, this one in Houston. Houston, the fourth most populous city in USA, is the world's capitol of the Oil and Gas industry. So it was no surprise I met many attendees from local oil and gas related companies. But, I also met many

It's not too early to think about what presentations and pre-conference training to attend while at SAS Global Forum 2012. Tutorials are an extra-fee that is only available as additions to a conference registration. But you can get a deal: Registration package 3 includes your choice of one Sunday Pre-Conference Tutorial.

Program update for 2013! The SAS Training Roadshow is back on tour. This year, we’re heading out to six rockin’ cities. We’d love to see you there. Cleveland - Portland - San Jose - Indianapolis ------------------------------------------------------------------------------------------------------------------------------------------------------------------------------------------------------------------------------------------------------------------------------------ As I prepare for my stint on the SAS Programming "Roadshow," it occurs to

Beans aren’t just good for your heart; they’re affordable, convenient, and packed with nutrients that have a wide range of health benefits including lowered LDL cholesterol, blood sugar control, weight management, and more. Beans are an excellent plant-based source of protein and fiber and are rich in minerals such as
Congratulations to all of these presenters for having been selected as Best Contributed Paper at WUSS 2012. Make sure you read all of the proceedings - you don't want to miss anything.
A week ago I had the pleasure of attending MWSUG 2012 in Minneapolis. There were many presentations on Data Visualization in various tracks including the following: Using SAS ODS Graphics - Chuck Kincaid Get the best out of SAS ODS Graphics... - LeRoy Bessler Program Assisted Patient Narratives - Faye
A few weeks ago I wrote an article on using the non breaking space character to prevent stripping of leading and trailing blanks in a string. Since then, I have discovered a few more instances where the nbsp can be a useful tool for creating graphs. One such instance came up last week

A super hot topic in most organizations is how to make the most of the troves of social data available. This Post-It Note author isn't specific about the SAS solution that is being used, so I'm going to speculate that he or she is taking advantage of SAS Text Miner, SAS Text


