Seien Sie ehrlich: Wie viele unserer Blogartikel haben Sie letztes Jahr gelesen? Wir alle kennen das - die Zeit ist knapp und man überfliegt nur einzelne Headlines, merkt sich Texte für ein späteres Lesen vor und vergisst es dann doch komplett… Deshalb haben wir einen ganz besonderen Jahresrückblick für Sie
Search Results: Visual Analytics (1744)
If you are a SAS Administrator who is tasked with managing SAS users including adding and removing SAS users in the SAS Management Console, assigning (or re-assigning) them to Groups and Roles, maintaining their General information and user Accounts, then you know that when number of users grow, at some
When my band first started and was in need of a sound system, we bought a pair of cheap yet indestructible Peavey speakers, some Radio Shack microphones and a power mixer. The result? We sounded awful and often split our ear drums from high-pitched feedback and raw, untrained vocals. It took us years
In today’s world of instant gratification, consumers want – and expect – immediate answers to their questions. Quite often, that help comes in the form of a live chat session with a customer service agent. The logs from these chats provide a unique analysis opportunity. Like a call center transcript,
Year-end outlooks from most analysts project the low-price environment in the oil market will continue for most of next year, but some pundits emphasize that the market has bottomed out and suggest recovery, though gradual, may be seen if increasing demand outpaces supply growth and sops up some of the
Times have changed. As the oil industry shutters and sheds investments that made sense during the two-year period in which oil rode comfortably above $90, the market is establishing a new equilibrium at $40/barrel. This despite the fact that the Baker Hughes domestic rig count is down 64 percent. It’s
You could argue that it’s misguided for someone like me to say data science doesn't have to be difficult. After all, I’ve been in the industry for many years and should have a few tricks up my sleeve for dealing with data. But with the latest data visualisation technology –
“Der hat doch´n Vogel – was für ein Freak” hab ich damals im Bio-Unterricht gedacht, als unser Lehrer davon erzählte, dass er sich im Frühjahr und im Sommer gerne früh morgens auf die Pirsch legt und die Vögel im seinem Garten beobachtet. Mit Vogel-Voyeurismus allein war es aber nicht getan, nein mein Bio-Lehrer dokumentierte
SAS Visual Analytics contains an Administrator Overview report which provides for Visual Analytics usage information by application, user, and object. To provide data for the report you must enable collection of key actions audit data in the Visual Analytics Middle-Tier. Auditing doesn’t just apply to Visual Analytics, it can be
Population movement is higher than ever. Buoyed by freedom of movement and critical events such as armed conflict and the European migrant issue, large groups of people are migrating across borders. In fact, population movement has now reached record levels. There are currently more displaced people globally than during the whole
How does SAS integrate with Hadoop? That's a question we often hear from people new to SAS who want to learn more about using SAS with Hadoop. At Strata + Hadoop World earlier this month, we were able to not only talk to attendees to answer their questions -- we were able to show
The Midwest SAS Users Group (MWSUG) 2015 conference is almost here and there’s a lot to get excited about. The event takes place October 18-20 in Omaha, NE. If you haven’t already registered, regular registration has been extended through October 13th. The full conference agenda is now available. We hope
Though crude oil prices edged up last week, the market remains well below VirtualOil’s original $50 strike price, meaning the hypothetical portfolio’s production is shut in in the spot market again. Oversupply continues while China GDP forecasted growth is slowing. Given the market outlook, the VirtualOil board has decided to
In my last blog, I demonstrated how to configure a SAS server to write a record to a log file showing who is opening, editing or renaming a SAS table. In this blog we will see how we can process that information. The documentation shows one way to do this via
We're wrapping up our “Meet the Team” blog series with SAS Solutions Architect Keith Renison. I was introduced to Keith earlier this year and was immediately impressed with his knowledge of advanced analytics and his enthusiasm for technology. He describes himself best: “I’m a combination of a data visualization snob
It’s been an amazing journey with Hadoop. As we discussed in an earlier blog, Hadoop is informing the basis of a comprehensive data enterprise platform that can power an ecosystem of analytic applications to uncover rich insights on large sets of data. With YARN (Yet Another Resource Negotiator) as its
A week from today, we'll be in New York City for Strata + Hadoop World, where we’ll kick things off at the Opening Reception. Be sure to stop by booth 543 to meet the team IRL (in real life)! They are excited about the event and eager to talk with attendees.
It’s me again!! We're at the halfway point of meeting our Strata + Hadoop World dream team. So far, you’ve met machine learning guru Patrick Hall; data management expert Clark Bradley; and advanced analytics specialist Rachel Hawley. Next up … Dan Zaratsian! I met Dan a few years back while preparing for Analytics 2013
I read an article recently discussing how runners inevitably slow down with age, particularly after 50. Data from the New York Marathon and Boston Marathon back this up with generally flat average finishing times for ages 20-49 followed by a steady, almost exponential, increase after 50. I haven’t reached the
Many administrators are familiar with the well-known “WIP Data Server” component of a SAS installation–so this blog takes a closer look at it, and shows how easy it is to monitor how large the database is growing. This data server contains a SAS-critical database known as the SharedServices Database, which is
The SAS Visual Analytics 7.2 release introduced context sensitive URLs for VA reports which means we can now directly pass parameter values in the URLs! This opens the door and allows for greater flexibility when needing to use a URL to access a VA report. One use would be if
Since our last VirtualOil update in May, oil prices have continued to take a beating. As the chart of the rolling five-year portfolio shows, much of our strip of options is now out-of-the-money and the average value per barrel of that optionality has sunk below $7. No surprise then that
I have been working on streaming analytics in conjunction with a project at Duke Energy, so a few months ago I was contacted by a colleague who wanted to look at the feasibility of applying what I’ve learned to our Internet of Things (IoT) initiative. In particular, we wanted to see if
SAS Studioとは SAS Studioは、SASをWebブラウザから(HTML5)利用できるアプリケーションです。従来のようにクライアントPC上にSASをインストールする必要もなくなり、Webブラウザさえあれば、どこからでもSASエンジンを利用することが可能です。そのためもちろん、クラウド環境での利用にも適しています。統計やSASの学習目的であれば無償で利用可能なSAS University Edition / SAS OnDemand for Academicsのインターフェースに採用されているのでそれをご利用の方はすでに慣れ親しんでいらっしゃると思いますが、実はそれに限らず、ほぼ全てのSASユーザーの方がご自身のSAS環境で利用可能な次世代のインターフェースです。 SAS Studioを使用して、データ、SASライブラリ、SASプログラムを利用することができ、新規にプログラミングすることも可能です。 最新バージョンでは、多くのSAS Enterprise Guideユーザーに支持されている、マウスによるポイント&クリックでクエリを作成できる「クエリビルダ」も追加されました。 それだけはありません。SAS Enterprise Guideと同様、ポイント&クリック操作だけで背後でSASコードを自動生成させる様々な処理が用意されている「タスク」も用意されています。また、既存のタスクをベースに、あるいはテンプレートをベースに新規にユーザー定義タスクを作成できるようになっており、XMLを編集するだけで簡単に作成できます。 さらには、SAS Enterprise Guideのように、そのタスクとコードを組み合わせて、処理フローを作成するビジュアル・プログラミング機能も提供されています。 使い方 まずは、どのような操作感なのかを以下の動画でご確認ください!(日本語字幕付きなので音声出さなくても内容理解できます) SAS Studioの日本語の利用ガイドもありますので、是非ご活用ください。下記日本語ドキュメントは最新リリース3.4の一つ前のバージョンのものになります。最新バージョンであるSAS Studio 3.4用の日本語ドキュメントも間もなく公開できる予定で、こちらのSAS Studioのドキュメントページにアップされる予定です。 プログラミング入門ガイド SAS® Studio 3.3 SAS Studioを使用してSASプログラミングを行うための基本的な使い方を紹介しています。 SAS® Studio 3.3 ユーザーガイド SAS Studioの全ての機能の操作方法を日本語で説明しています。 動作アーキテクチャ タスクやプログラムコードを実行すると、SAS StudioはSASサーバーに接続しSASコードを実行します。SASサーバーは、クラウド環境上に配置することも可能ですし(SAS OnDemand for Academicsや、SAS University
Krystian Matusz is what I’d call a super SAS user. He currently holds seven out of the nine credentials SAS offers. SAS Certified Advanced Programmer for SAS 9 SAS Certified Base Programmer for SAS 9 SAS Certified BI Content Developer for SAS 9 SAS Certified Clinical Trials Programmer Using SAS
今年もユーザー総会が8/6・8/7で行われました。会場にて、あるユーザーの方に「SAS Enterprise Guideのよりよい使い方などに関する情報があればもっと教えてほしい」と相談を受けましたので、今回はそれを取り上げたいと思います。 SAS Enterprise Guideとは、SAS Business Intelligenceの主要アプリケーションのひとつです。定型レポートの作成や定型レポートで発見した課題をより深く掘り下げて詳細な課題箇所を特定するアドホックレポーティングに使用する、グラフィカルユーザーインターフェースを備えたツールです。SAS Global Forumではそのようなツールの使い方Tips等実際のユーザーの方々の便利な利用方法が紹介されたりしています。今回は、SAS Global Forum 2015および2014から、SAS Enterprise Guideの使い方に関わるものをピックアップしてみました。 最新バージョンで追加された新機能については、こちらの What's New in SAS(R) 9.4 にまとまっており、最新バージョンの7.1および7.11においても継続的に機能が追加されていますので、是非ご参照ください。 二つほど最近追加された機能をご紹介します。 Enterprise Guideには昨今約90に上るタスク機能が搭載されています。初心者の方であれば自分の使いたいタスクを見つけるのが大変なので検索機能が欲しいでしょうし、使い慣れた方であれば、マウス操作とはいえ、使いたいタスクまでマウスを移動させる時間も惜しいでしょう。さらには、いつも使うタスクは決まっている人は、「最近使ったタスク」が欲しいことと思います。最近これらの悩みを解決する「タスクブラウザ」という機能が新たに追加されました。 さらに、私の身近にもEnterprise Guideをマウスで目にもとまらぬスピードで操っている人がいます。そのような人が長年待ち望んでいた機能も実現しています。プロセスフローダイアグラム上で結合したい複数のデータを選択し、クエリビルダを選択することで、複数の入力テーブルを一度の操作で設定することが可能となりました。 是非ご活用ください。 このようなことが、下記に紹介するドキュメントには掲載されています。 2015 Creating Keyboard Macros in SAS® Enterprise Guide® キーボードマクロを作成する方法が紹介されています Easing into Analytics Using SAS® Enterprise Guide® 6.1 基本的な使用方法が紹介されています Joining Tables Using SAS® Enterprise
Oh, how times have changed during my 20-plus years in the insurance industry. Data wasn’t a word we used much back in the 80s and 90s, unless of course you worked in those arcane and mysterious IT data centres. Even amidst the computerisation of the insurance industry in the 80s, many
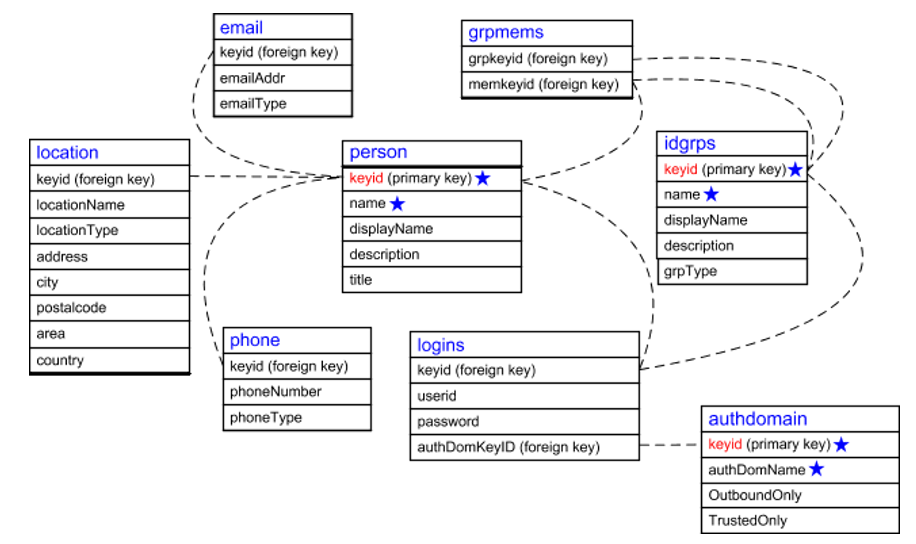
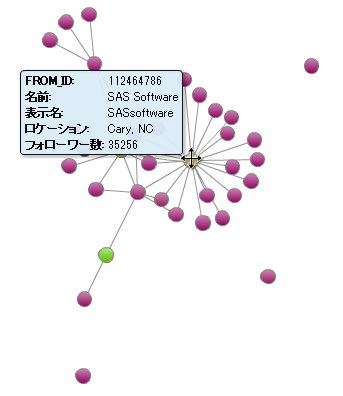
SASではグラフ理論(グラフ分析と言ったりもします)や、そのビジュアライゼーションを容易に実践することができます。本ブログでは、何回かにわたりこのトピックを扱っていきたいと思います。グラフ(ネットワーク)は世の中のあらゆるところに存在します。リレーショナルデータベースのER図として抽象化されている世界(企業の業務など)とは異なり、現実の世界では全てのモノが相互に関連しています。昨今注目されているIoTにおいても単に生成されるデータを個別に分析するだけでなく、それによってつくられたネットワークそのものを分析対象にすることで新たな洞察が生まれる期待も大きいと考えられます。今回はまずソーシャルネットワークを例にその様子を紹介していきます。 はじめに IoTに代表される昨今のように全てが相互に接続された世界では、ある一つのモノそのものを詳細に分析するだけでなく、異なるモノとモノ同士がお互いにどのように関連しているかも理解することの重要性が増しています。ソーシャルネットワークは、モノやサービスについて消費者がどのように考えているか、あるコミュニティが自社に関係のある別のコミュニティとどのようにリンクしているのか、インフルエンサー(情報発信力あるいは影響力をもつ人々)はどこにいるのかなどについて驚くべき事実を提供してくれることが多いのです。このようなネットワークについて理解することで、自社のビジネスにとって役立つ洞察を与えてくれたり、次のマーケティングキャンペーンにおいて誰をターゲットとすべきかについての意思決定に役立つでしょう。 ネットワーク(グラフ) ネットワークとはモノ(ノード)と、それらモノとモノとを接続するリンクの集合によって構成されます。リンクによって様々な関係性を表現できます。この定義は非常に一般的ですが、我々はありとあらゆるところで、このネットワークを見出すことができます。 数学的には、ネットワークはグラフと呼ばれています(データビジュアライゼーションで使われるグラフとは異なる意味なので注意してください)。相互に接続されたモノは数学的には頂点といい、頂点と頂点を結ぶリンクは、エッジ(辺)といいます。グラフの性質は数学、工学さらには社会科学といった領域でグラフ理論という研究対象となっています。 一方で、ネットワーク・ビジュアライゼーションはこのグラフをビジュアルに表示するためのものです。もっとも一般的な形は、リンクノードダイアグラムで、頂点を表す点または円があり、それらが辺を表す直線や曲線でつながっているものです。頂点の属性は、大きさや色、形にマップされ、辺の属性はリンクの幅や色にマップすることができます。 辺の属性として重要なのが「方向」です。ほとんどの関係性(リンク)は方向性がない、対称なものです。例えば、Facebookにおける友人などがそれにあたります。しかし「方向」があり非対称なネットワークもあります。Twitterにおける"フォロー"がそうです。このような場合には、ビジュアライゼーションは矢印などのような線で関係性の方向を表現することができます。 ソーシャルネットワーク 複雑系の一つの特徴的な側面であり、またそれが全体を予測することを困難にしている理由の一つでもあるものに、それを構成する構造と各構成要素の振る舞いとの間の相互作用があげられます。 その相互作用は、ソーシャルネットワークにおいて特に顕著にみられます。あなたを知っている人があなたの行動に影響を与えたり、またその逆であったりするでしょう。この後紹介するように、ネットワークは「アクター」(人間のことが多いですが、時には自動化されたコンピュータ・エージェントであったり、組織であったりします)によって構成され、それぞれの間の関係性や行動(フォロー、いいね!やリツイート)によって関連付けられます。「アクター」の行動による影響は、関連付けられている別のアクターに対して広範囲に作用します。つまり、全体の中で重要な位置にいるアクターは、グループ全体に対して大きな影響を与えることができるのです。 では、我々はどのようにソーシャルネットワークを理解すればよいのでしょうか?基本的な問いから始めてみます。 ネットワークの基本的な構造はどうなっているか?ひとつの団結したグループなのか?それとも緩くつながった強固なコミュニティなのか? インフルエンサー(影響力のある人)は誰なのか? これらの問いを総合するとネットワークの影響がお互いにどのように作用しているのかをマクロな視点とミクロな視点で明らかにすることができます。 データ準備 今回は、ソーシャルネットワークの分析を紹介するためにツイッターデータを使用します。SAS Visual Analyticsでは、ツイッターデータを取り込むことが可能ですが、非常に大きなデータをインポートするとデータが非常に膨大になります。そのような場合にネットワークをよりよく理解するために、ネットワーク分析のためのツールであるSASのOPTGRAPHプロシジャを使用します。将来のバージョンでは同様のことをSAS Visual Analytics上だけでテキスト解析やフォーキャスティングと共に利用できることになる予定です。 この例では、#SASUSERS, #SASSGF14といったハッシュタグで抽出したツイッターデータを使用します。このデータは以下のような構造をしています。 前述したように、このネットワークは、これらのツイートをしているユーザーたちと(テキストそのものは今回は関係ありません)、それぞれのユーザー間の関係性(AがBをフォロー)によって表現されます。その情報に基づいて、二つの列、FROM_IDとTO_ID(このIDはツイッターのユーザーIDです)を使用したデータ構造を作成します。RELATIONSHIP列は、このリンクの意味を表現しています。 このテーブルをSAS Visual Analyticsにロードしてみるだけでも、以下のような興味深いネットワーク構造を見ることができます。 フォローワーの数などを人の属性に設定することにより、このネットワークに含まれている人あるいは組織についての最初の洞察を得ることができます。 もちろん、このように考える方もいるでしょう。フォローワーの数が多いからといっても必ずしもその人物がネットワーク上の重要な人物とは限らないだろう、と。では、より深く理解するためにコミュニティとキーとなるアクターを特定する方法を見てみましょう。 コミュニティの検出 コミュニティの検出、あるいはクラスタリングとは、つながりの強いノード同士をグループ化してネットワークをいくつかのサブ・ネットワークに分解していくプロセスです。 SASではこのようなグラフ分析のためのツールOPTGRAPHプロシジャを提供します。OPTGRAPHが提供する様々な機能はまたの機会にご紹介します。今回は、このコミュニティ検出に使用したいと思います。以下の例では、指定した分解解像度に基づいて、一度に二種類のコミュニティグループの計算をしています。解像度を大きくするとより多くのコミュニティを生成することができます。 proc optgraph loglevel = moderate data_links = data.tweet_edges out_nodes = work.tweet_groups graph_internal_format = thin; data_links_var from =
The SAS Visual Analytics 7.2 release introduces a new look and feel to the Hub with the modern (HTML5) version. It also introduces a new feature, Shared Collections, which allows an administrator to push a Shared Collection to all users’ Hub view, including Guest access. And bonus - it will