I have been working on streaming analytics in conjunction with a project at Duke Energy, so a few months ago I was contacted by a colleague who wanted to look at the feasibility of applying what I’ve learned to our Internet of Things (IoT) initiative. In particular, we wanted to see if the kind of analytics we were using in SAS® Event Stream Processing could run on some of the IoT gateway devices, which are devices that sit at or close to the edge of the IoT.
To build out a demonstration application to test this idea, we used the Dell IoT gateways, which provided the compute power we needed but could be deployed out on the edge of the internet, connecting to the sensors locally.
The plan was to show this application at the Intel Developers Forum (IDF). We received very positive feedback at this event, so I wanted to share what we put together to demonstrate the internet of things and what we learned along the way.
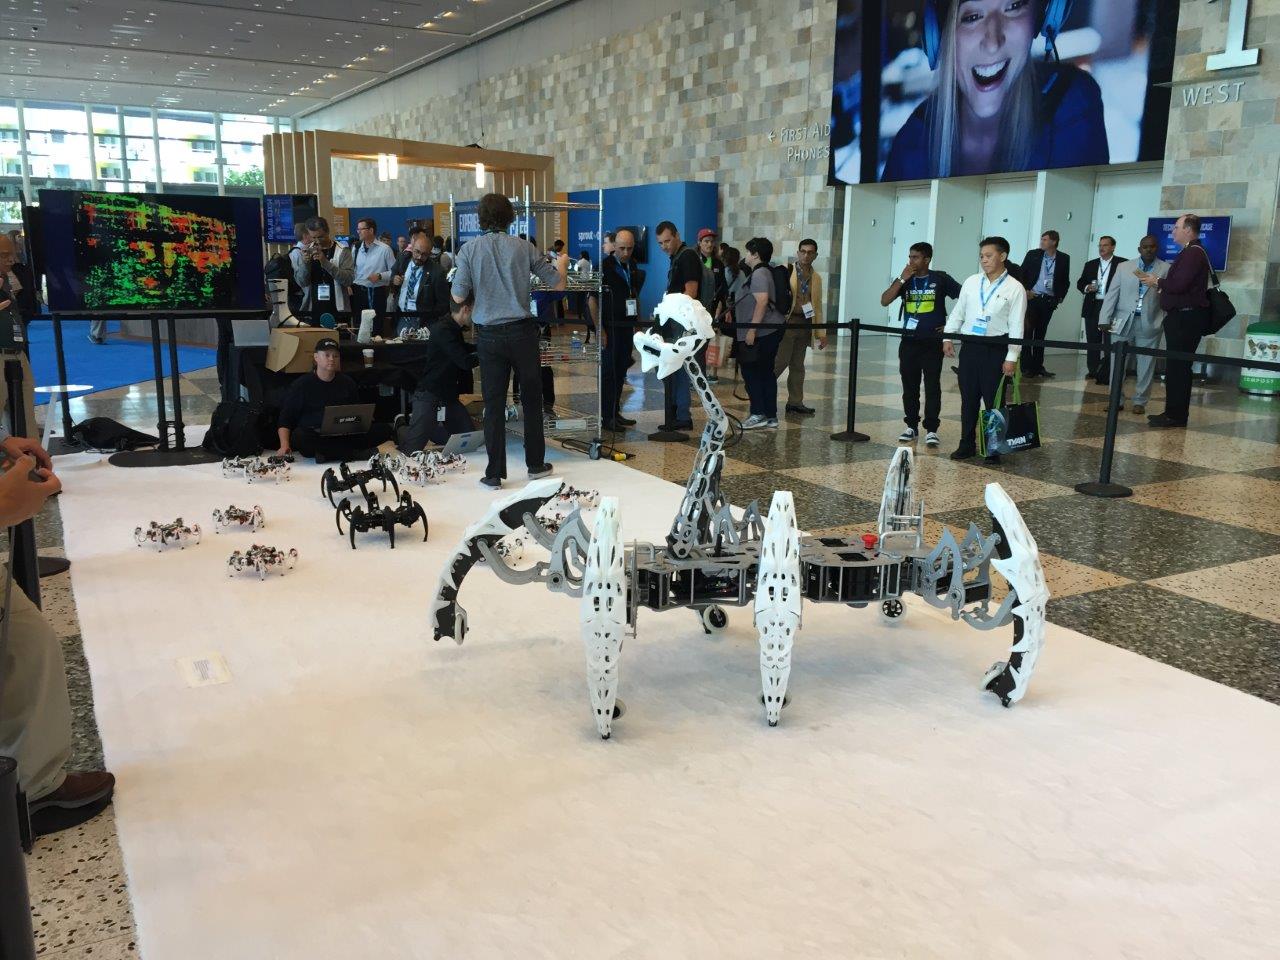
As a test case, we wanted to study the crowd activity around the conference and look for patterns related to various locations and items on the conference schedule. We built sensor packages that would measure different aspects of crowd activity – motion, sound, light, temperature, humidity. We placed the sensors at multiple locations in the convention center. We had two in our booth to capture our activity and show people what they looked like.
We also had sensors in other locations on the demo floor, in the back of the house to capture activity by the support staff, and in the social space and entrance to the presentation rooms. We also equipped our booth with a cloud server, running it as a private cloud configuration. With this collection of equipment we were able to collect the data from all these strategically located sensors over time and perform analytics on this big data using SAS® Visual Analytics .
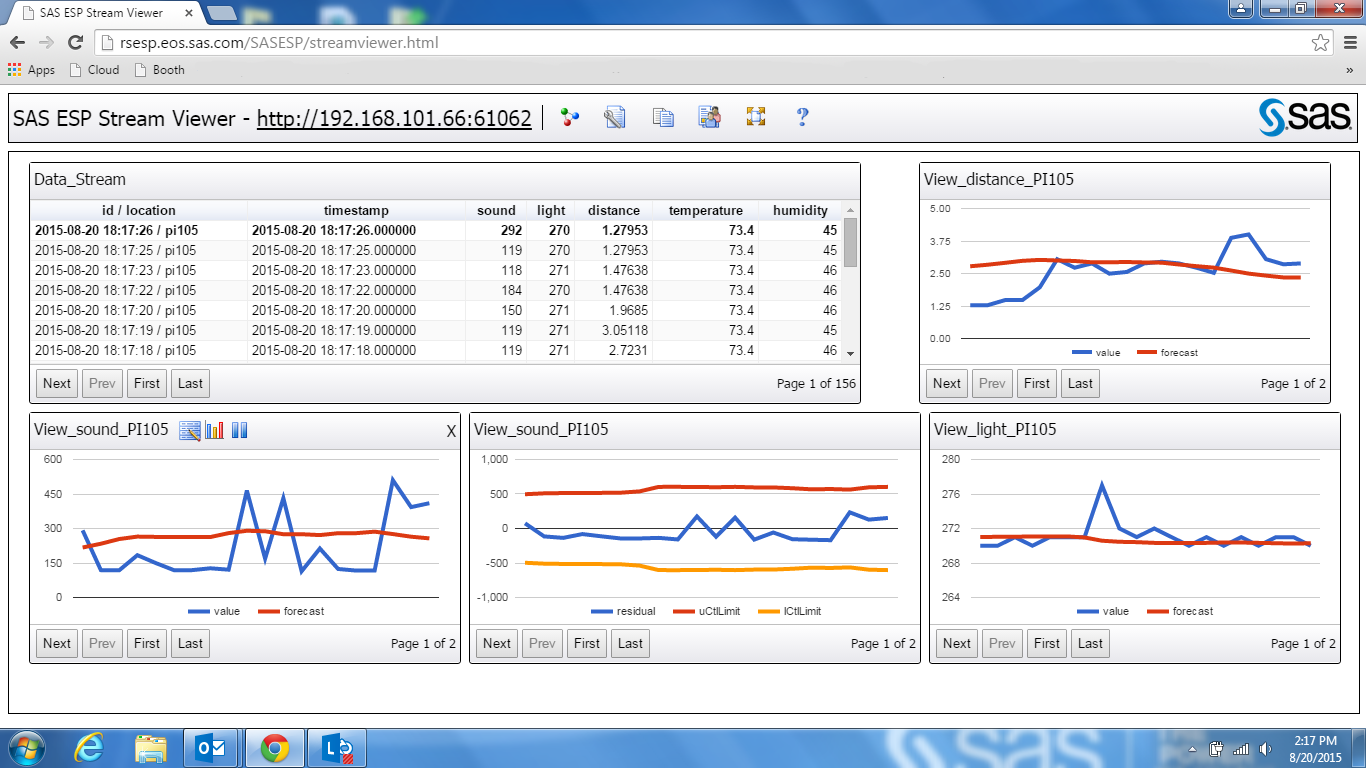
Our approach validated the SAS strategy of multiphase analytics, where analytic power is applied at various levels. At the IoT gateway, we analyze data locally in real-time as it streams in from the sensors. Just as I found with a previous project I'd worked on analyzing the electric power grid, it is not unusual for sensor data streams to merely record, and thereby confirm, that conditions being monitored are stable or unchanging. One key piece of analysis is to determine normal patterns, then detect abnormal patterns, and finally identify what is causing the abnormalities. For example, in our demo the motion detectors showed when people or equipment moved by. This type of signal is an example where the gateway was able to send these analytic results to the cloud, instead of just sending the raw data, which then would have had to be analyzed on the cloud. When an internet of things configuration includes many devices, and mostly normal pattern data, doing analysis on the edge like we did can save on network bandwidth.
We only used the gateway to look at a short period of data, in this example for only a few seconds. The cloud stores all the data/results received from all of the gateways and sensors. This aggregation allows more in depth modeling across both time and location that can be used in combination with additional data to model other interesting features. In our application we also added the conference agenda, which allowed us to model how crowd flow interrelates with various scheduled activities. We were also able to build predictive models based on previously observed activity to predict expected activity for upcoming items on the agenda.
The project was a great learning experience about building an internet of things application. One finding is that analytics on the edge provides a lot of value. If your application involves a large number of sensors and/or a high data stream rate, then you will require analytics on the edge. Many attendees at the Intel event said they foresee saturation in network bandwidth, which will become the limiting factor for scaling up the IoT. By analyzing data at the edge, and only sending the interesting results to the cloud, you can scale to a much larger level for your IoT project.
A second finding related to the capabilities of the smaller edge devices. We found they had sufficient compute power locally to handle multiple nearby data streams, which makes them good for analyzing data in motion as it comes off the sensors. A third finding is that there are a large number of sensor types with different protocols used to send their data. Part of Intel’s IoT initiative is to provide a standard data layer so the analytics routines can abstract this out and not get bogged down in the configurations.
A fourth finding is about the importance of security, as these devices are, by definition, positioned out on the far flung portions of the network, where security may be less stringent. Internet of things participants must build in security from the start in IoT frameworks.
Finally, I was able to see all the different skill sets needed to implement an internet of things project like this. I brought to the project experience in analytics and software, but this effort involved many areas. I've worked with a number of hardware engineers, but in this case we were looking at the capabilities of small scale devices, as opposed to the large multi-node grid environments I've been working with. Networking was a new area for me, involving considerations for the characteristics of the options for WiFi or cellular connections. And a new set of sensors brings a learning curve of what analytic insight is possible with the data stream.
So overall our demo application was able to validate the capabilities of analytics at various points in the internet of things. We were able to learn which areas of the conference had the most activity and how the schedule and related activities interacted. I enjoyed talking with others working in IoT, like Kirsten Billhardt at Dell, and seeing how the components of IoT come together to solve real issues. You can see more info about the SAS Internet of Things initiative, and I’m looking forward to sharing more updates as I work on this project.