You’ve heard about the smart grid, but what is it that makes the grid smart? I’ve been working on a project with Duke Energy and NC State University doing time-series analysis on data from Phasor Measurement Units (PMUs) that illustrates the intelligence in the grid as well as an interesting application of analytical techniques. I presented some of our findings at the North American SynchroPhasor Initiative (NASPI) workgroup meeting in Houston recently, so I thought I’d share them with a broader audience.
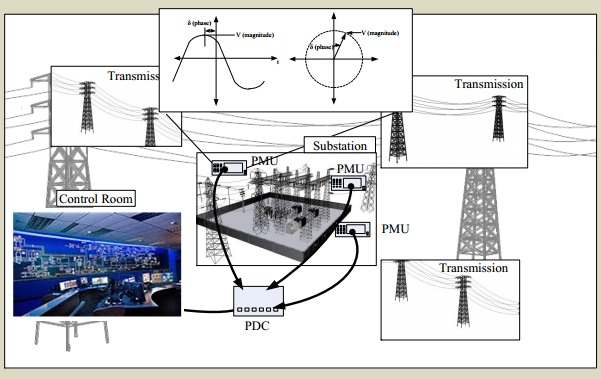
Phasor Measurement Units (PMU) take measurements of the power transmission grid at a much higher speed and fidelity than previous systems provided. PMUs take measurements on the power frequency (i.e. 60hz), voltage, current, and phasor angle (i.e. where you are on the power sine wave). These units take readings at a speed of 30 measurements/second, while the previous systems just took readings every 3-4 seconds. This more frequent interval provides a much more detailed view of the power grid and allows detection of sub-second changes that were completely missed before.
Another great feature of the PMUs is their very accurate time measurement. PMUs are installed at points along the power grid miles apart from each other. For example, Duke Energy has over 100 PMUs installed across the Carolinas. To analyze data and learn about the whole grid, we need to synchronize the measurements taken at these locations. PMUs have Global Positioning System (GPS) receivers built in, not to determine the location, but so all can get the same accurate time signal. Since GPS systems provide time accuracy in the nano-second range, this is sufficient for our measurements at 30/second. This accuracy is most critical in the measurement of phasor angles. By comparing the phasor angles between locations, we get a measure of the power flow between the locations. Since the measurements are of something changing at a frequency of 60hz, the time stamp of the measurement must be of significantly higher precision than what is being measured.
Working with this data has highlighted the similarity and differences between working with big data and high-speed streaming data. Big data is typically a large amount of data that has been captured and stored for analysis. Streaming data is constantly coming in a high rate of speed and must be analyzed as it is being received. One of the many interesting things about this project is that is involves both big data and streaming data.
-

- Streaming data
-

- Big data
So what have we learned working with this data? The main purpose of this project is to detect and understand events that are affecting the power grid, with the objective of keeping the grid stable. We have learned there are a number of time-series techniques that are needed for the different aspects of providing the needed answers. The analysis flow breaks down into three areas: event detection (did something happen?), event identification (what happened?), and event quantification (how bad was it?).
For event detection, the task at hand is streaming data analysis. The system generates 30 measurements/second on hundreds of sensors and tags. Fortunately a majority of the time (>99.99%) they indicate that no event of any kind is occurring. Since there are time-series patterns present they can be modeled and used to detect when there is a deviation from the normal pattern. Determining these models allows us to look forward with a very short-term forecast and then instantly detect an event of interest.
-
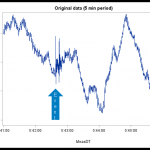
- Event seen on Frequency measurement
-
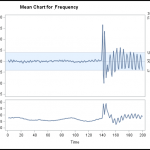
- Monitor forecast residual
Event identification is the next order of business. An event of interest doesn’t necessarily mean there is a problem or that one will develop. Some events are random, like a lightning strike or a tree hitting a power line. Others represent some type of equipment failure. We’ve determined that many of these events produce a similar ‘signature’ in the data stream, because time-series similarity analysis and time-series clustering have been able to match the incoming events to previously seen events. Knowing which previous event signatures are non-consequential allows us to safely ignore them.
-
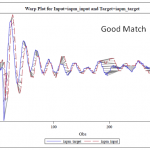
- Similarity analysis – Good match
-
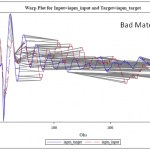
- Similarity analysis – Bad match
Finally we look at event quantification. For some events, the question is not just that the event is occurring but also whether the magnitude of the event gives cause for concern. An example is oscillation on the power grid. Small but diminishing oscillations are not necessarily a problem, but larger ones that are increasing may require further attention. Once the event type is identified, each has some specialized techniques to determine their magnitude and consequence.
This project has provided interesting insights into how to make the power grid smarter. Many of these techniques are also beneficial to streaming data analysis seen in other industries and applications. If there is a need to automatically identify and categorize system events based on data patterns, or filter out events that are non-consequential, then these techniques will be helpful.
Photo credits
PMUs in the power grid: Syncrophasor Technologies and their Deployment in the Recovery Act Smart Grid Programs, August 2013 report by the US Department of Energy
Firefighter image credit: photo by US Navy // attribution by creative commons
Hoover Dam image credit: photo by IAmSanjeevan // attribution by creative commons