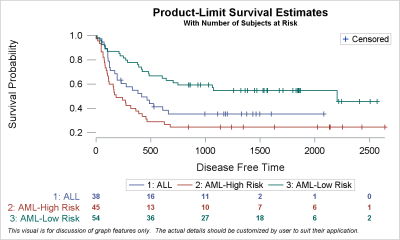
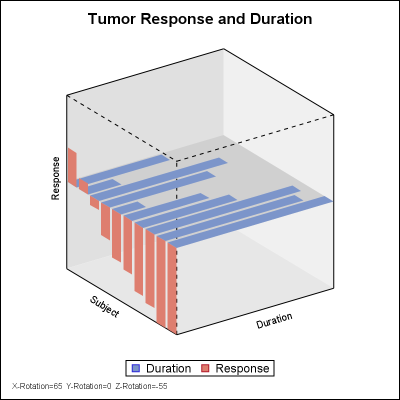
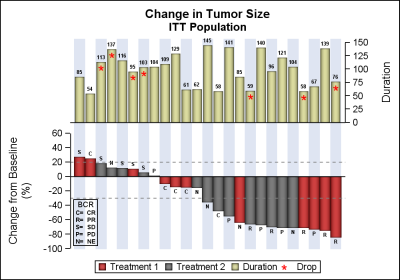
Analysis of clinical data is easier when the data is presented in a visual form. Clinical graphs have special requirements to deliver study data together in one concise graph, often with statistical information that is aligned with the data values on the x or y axis. SAS SG Procedures and GTL provide you the features you need to create effective clinical graphs. Also see “Clinical Graphs using SAS”, a SAS Press.

Survival plots are automatically created by the LIFETEST procedure. These graphs are most often customized to fit the needs of SAS users. One way to create the customized survival plot is to save the generated data from the LIFETEST procedure, and then use the SGPLOT procedure to create your custom


