Just getting back from PharmaSUG 2014 in San Diego. The conference was great, both inside and outside. The organizers ordered up some great weather for the Padres game and also for dinner on the flight deck of the Midway Carrier.
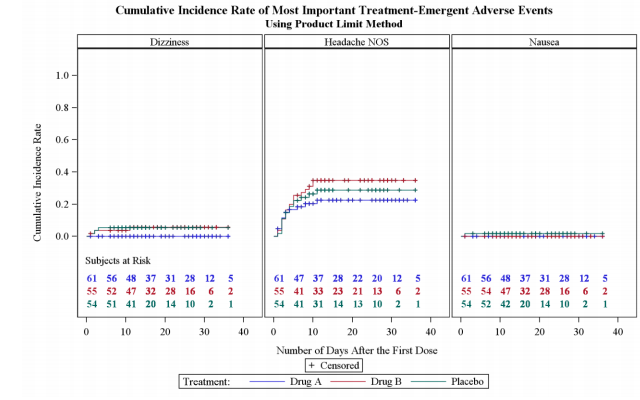 Our focus here being on graphics, we were all extremely gratified by the presentations in the Data Presentation section. Amos Shu got us started with graphs for Adverse Event timeline graphs and panels in his paper Techniques of Preparing Datasets for Visualizing Clinical Adverse Events.
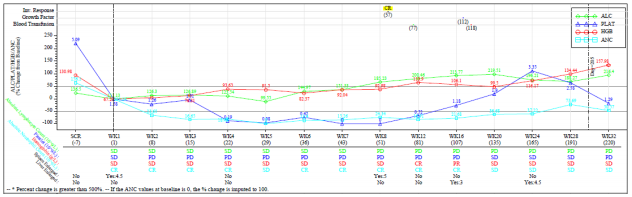
Wu, Dai and Gau presented a Graphical Representation of Patient Profile for Efficacy Analyses in Oncology with Efficacy Patient Profile graphs using GPLOT and ANNOTATE:
Mayur Uttarwar and Murali Kanakenahalli proposed Developing Graphical Standards: A Collaborative, Cross-Functional Approach to ensure the correct list of Symbols and colors for the plots in the graph.
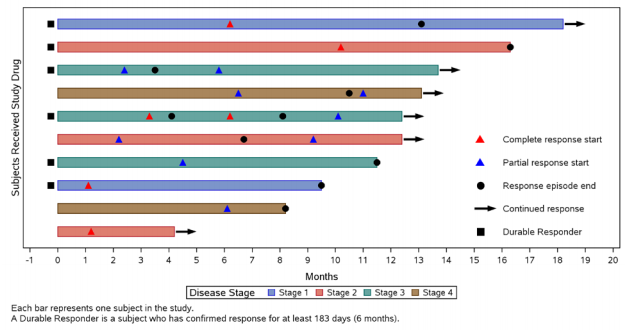 Stacey Philips presented a Swimmer Plot: Tell a Graphical Story of Your Time to Response Data Using PROC SGPLOT, displaying disease stages for each subject with additional information on the events.
Kriss Harris presented Napoleon Plot for PharmaSUG and I Am Legend for PharmaSUG , presenting displays for assessing treatment safety, and ways to create just a legend, when the number of entries in the legend are too many to be included in one graph.
Jeffery Meyers presented Kaplan-Meier Survival Plotting Macro %NEWSURV which used the GTL layouts in creative ways to display loads of information in one plot or panel.
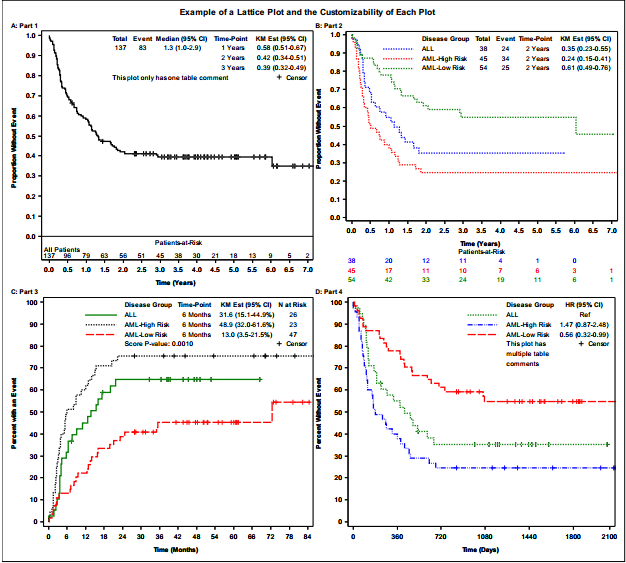
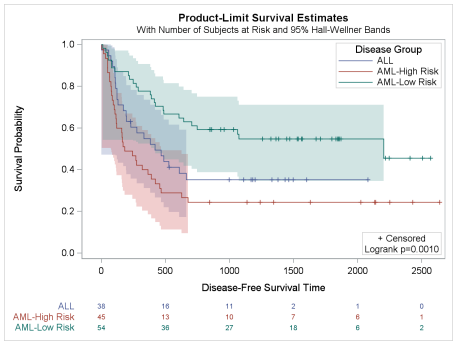 Warren Kuhfeld presented ways to customize the popular Survival Plot graph created by the LIFETEST Procedure for SAS 13.1 using a combination of %ProvideSurvivalMacros, Customization macros, %CompileSurvivalTemplates to create the customized templates, and then run the LIFETEST procedure to produce the customized graph output.
 Finally, I presented my paper from SGF 2014 -Up Your Game with Graph Template Language Layouts using GTL layouts to create complex custom graphs. This paper will get you started using the GTL layouts to go beyond the graphs you can create using the SGPLOT procedure.
As usual, PharmaSUG lived up to its reputation of taking care of its attendees by providing fabulous food for breakfast, lunch and dinners. In addition to all the knowledge, I feel like I also gained 5 pounds.
For me, the highlight is always meeting and interacting with SAS users, who bring so much enthusiasm to the conference. One quote that I took back to my team from a presentation was "Making graphs with SAS is FUN". It is nice to get validation of our efforts to provide you the tools you need to easily create beautiful and effective graphs with SAS.

8 Comments
I completely agree that it was a great conference and I'm so glad you liked my quote! Unfortunately I think we've got our work cut out for us convincing people that graphing in SAS is fun. I usually get a lot of groans and "Graphs are so complicated!" whenever I mention which section I presented in. 🙂
You are right. We'll keep chipping away at it. Many of the folks espousing such opinions have not used SAS graphcs for years.
Also, it is good to note your "Swimmer Plot" is proving of interest to other SAS users on the communities page: https://communities.sas.com/message/214618
Sanjay; What a great review of new graphics at PharmaSUG 2014, up so fast. This will benefit many users of SAS and JMP software. And thanks again for helping me name my next graphical presentation.
Great meeting you again, Charlie. Excellent conference.
I did go back to get a better read on VA Explorer and VA Statistics. I am sure you can find the right information on the SAS web page.
SAS Visual Analytics: http://www.sas.com/en_us/software/business-intelligence/visual-analytics.html.
SAS Visual Statistics: http://www.sas.com/en_us/software/analytics/visual-statistics.html
Hello Sanjay,
Thank you for listing me in this blog, and it was a lot of fun discussing graphs with you and the other presenters at the conference. Wanted to send a quick note to let you know that my name is misspelled as Jeffery Meyer instead of Jeffrey Meyers in the blog.
Thanks much!
Yes, Indeed. It was great fun to meet with all of you who are making graphs using SAS, and hear about your successes and the problems you are facing. Sorry about the mis-spelling of the name. Now fixed.
Pingback: Lab Values Panel - Graphically Speaking
Dear Sanjay Matange,
Could you provide some program about the Time-dependence ROC?