Early last year I wrote an article on how to create the "Most Frequent Adverse Events Sorted by Relative Risk" graph using the SGPLOT procedure. The key issue here is that such a graph normally displays two plots side by side, a scatter plot of the proportion values by treatment on the left and the Relative Risk values on the right. Since the SGPLOT procedure normally produces single cell graphs, I called this the "Two-in-One Graph".
The technique described in the article is meant for users familiar with SGPLOT who do not use GTL. The article describes how to use the X and X2 axes with Y (or Y and Y2 with X) to split a single cell into two parts. This technique useful in other situations too.
However, the right way to create this graph is by using GTL to define a graph layout with two cells using a LAYOUT LATTICE. Each cell is populated with the appropriate plot to represent the data. This is exactly what Matt Cravets and Jeff Kopicko of Receptos, Inc. have done for the graph shown below. They used GTL to define the graph, allowing them to place the x axis data at the bottom of both graphs. In addition to that, Matt and Jeff wanted to display the corresponding values of "Numbers Needed to Treat" at the top of the graph on the right. In this case NNT=1.0 / RiskDiff.
Clearly, the axis on top would include the value infinity when RiskDiff is 0.0. This is where Matt wrote in to me to see if there was a way to create an X2 axis that would go from smller negative NNT values on the left to -infinity in the middle, and then +infinity to reducing positive NNT values to the right as shown here in the final graph.
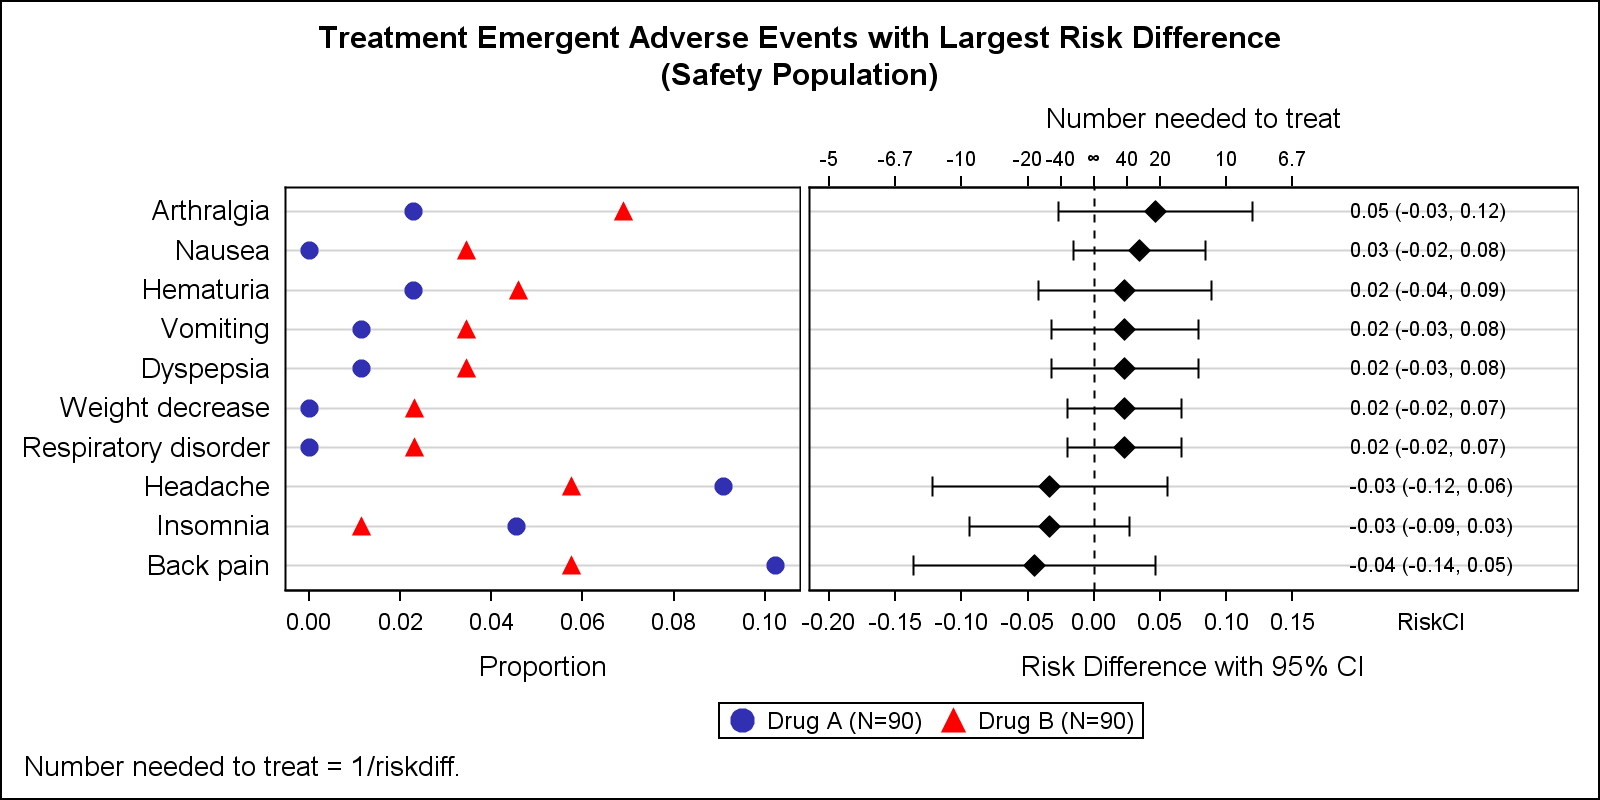
In the graph above, the X2 axis on the top of the right cell spans from -5 to -infinity at the Riskdiff=0 point. Then it goes from +infinity to 6.7. These are two separate axes, and I cannot think of any way to create this as a real axis. The way to get this was to draw the same RiskDiff axis for X2, but replace each tick value by the appropriate inverse value. And for the inverse of 0.0, we used the Unicode "infinity" symbol. This is done by using the TICKVALUELIST and TICKDISPLAYLIST options on the X2 axis:
x2axisopts=(label="Number needed to treat" tickvalueattrs=(size=7)
linearopts=(viewmin=-0.20 viewmax=0.35
tickvaluelist=(-0.20 -0.15 -0.1 -0.05 -0.025 0 0.025 0.05 0.1 0.15)
tickdisplaylist=('-5' '-6.7' '-10' '-20' '-40' "(*ESC*){unicode '221e'x}" '40' '20' '10' '6.7')
tickvaluefitpolicy=none)
The above technique also made it easy to ensure the corresponding values on the X and X2 axes are correctly lined up. Since the middle value is really both -/+ infinity, another minor change would be to place the Unicode -/+ sign in the middle as follows. I have removed the value '40' to reduce congestion. Note use of TickValueFitPolicy=none to prevent dropping of valued due to collisions.

The infinity sumbol in the Unicode fonts used is a bit smaller than what I would prefer to see, but there is no way to increase the size of just one symbol in the list. If this is necessary, one could use SGANNOTATE (SAS 9.40) to insert a bigger symbol. The SAS 9.4 AXISTABLE is used to display the RiskCI values.
Full SAS 9.4 GTL code (courtesy of Matt and Jeff) : AE_Plot_with_Riskdiff_And_Nnt


1 Comment
Lucida Sans Unicode has a bigger infinity symbol relative to the digits.