The PharmaSUG 2013 conference in Chicago this week was awesome. From the perspective of graphics, there was great interest in using SG Procedures, Designer and GTL for building clinical graphs. It was nice to see many papers by users on how they are using these tools for creating graphs on a daily basis. One presenter concluded her paper as follows:
"With ODS graphics in Base SAS 9.3, many commonly used graphs can be easily generated without the need to program or convert data for graph production using other software applications. As a result, clinical researchers, including PK scientists and phamacometricians, can focus on data exploration, analysis and interpretation, without struggling with programming languages. In practice, this user-friendly graphical tool offers benefits in a variety of areas, e.g. visual access to data as early in the process as possible; easily integrated in automation tools, etc., and provides great opportunities for a streamlined drug development process."
- Alice Zong, Paper # PharmaSUG 2013 - Paper SP09 "SAS® 9.3: Better graphs, Easier lives for SAS programmers, PK scientists and pharmacometricians"
I love this sentence: "As a result, clinical researchers, including PK scientists and phamacometricians, can focus on data exploration, analysis and interpretation, without struggling with programming languages."
Kevin Lee of Cytel said he always uses ODS Graphics Designer to make all his graphs. It is good to see this interactive tool prove useful not only to the new graph user, but also to experienced graph programmers.
There was great interest in the various presentations on creating or modifying Survival Plots. Multiple papers were presented on this topic, always a popular one.
I presented the paper "Patient Profile Graphs using SAS". This was a late entry into the conference as a slot came open in the "Management and Support" track. I was certainly afraid no one interested in Patient Profile graphs would notice this paper in this track. So, I was very gratified to see a "standing room only" crowd of attendees. I also appreciated the multiple suggestions I received from the programmers on how to further improve this graph.
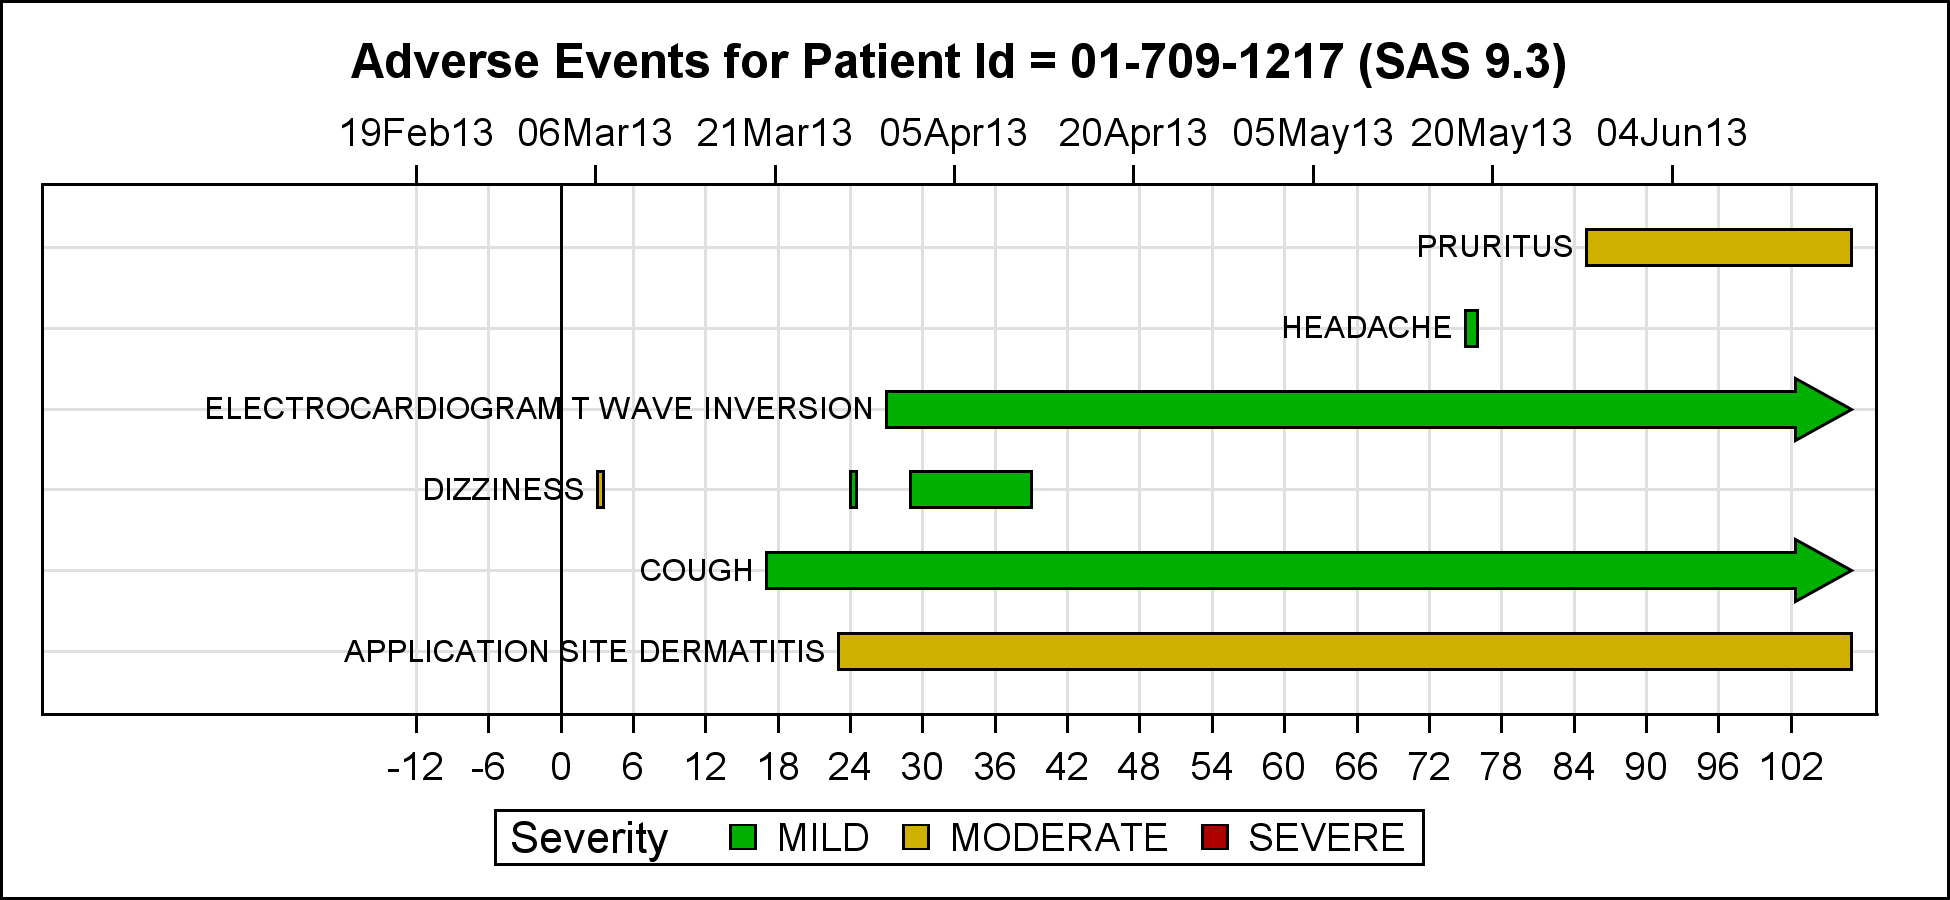
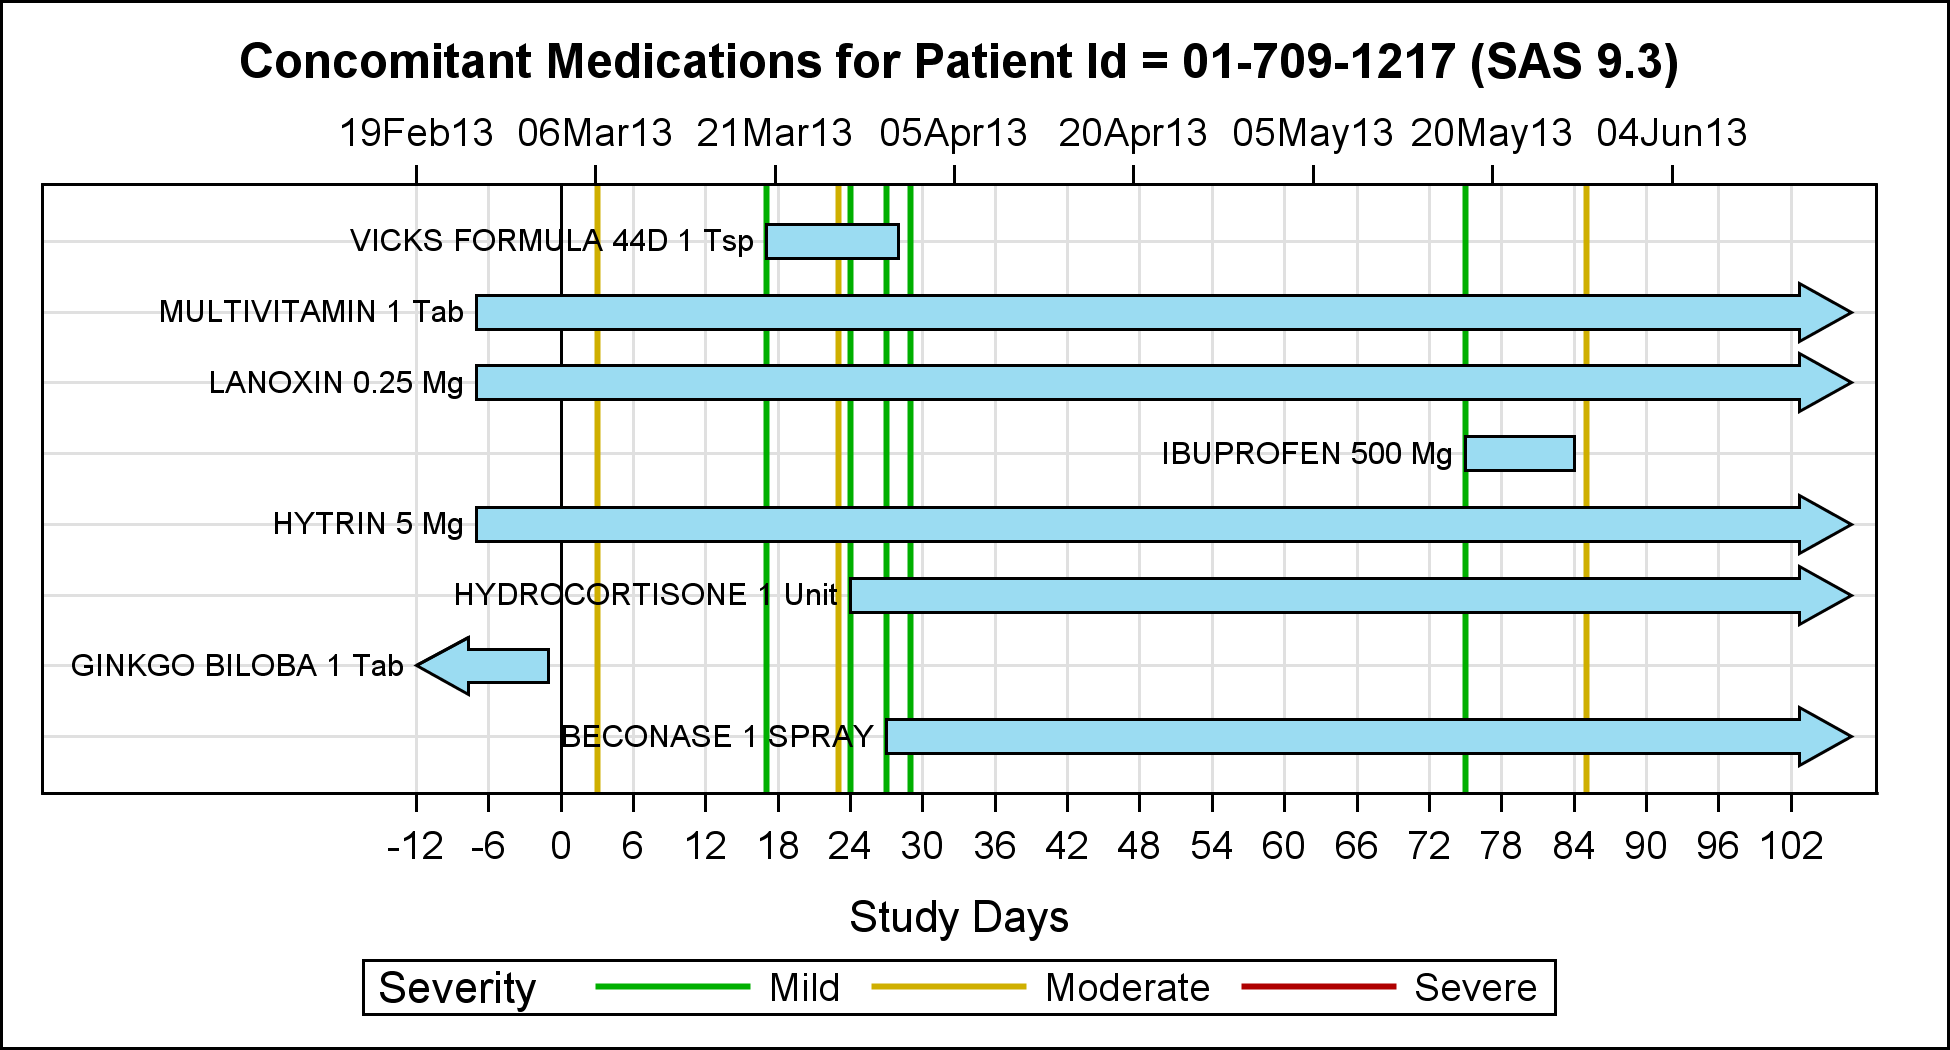
The graphs AE and CM above are from the paper. Note, the "zero" day value in both graphs is synchronized. I will post an improved version soon.
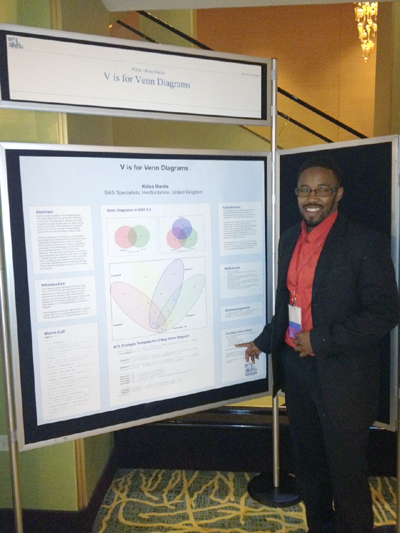
Kriss Harris showed off his Venn Diagram poster created using the DRAWOVAL statement in the GTL syntax. Here is Kriss pointing to some important feature of his graph.
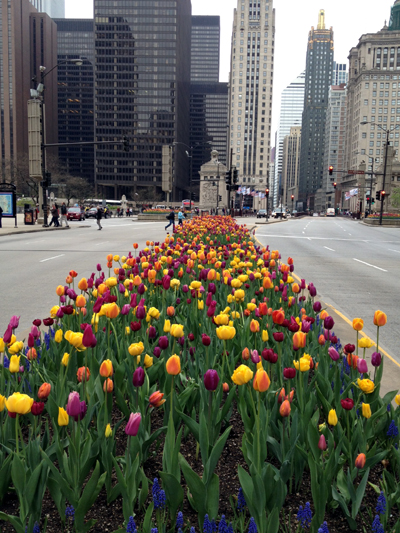
The conference was on the Magnificent Mile on Michigan Ave. It was nice to see the blooming tulips in the middle of the road, along with all the other nice flower beds all around.