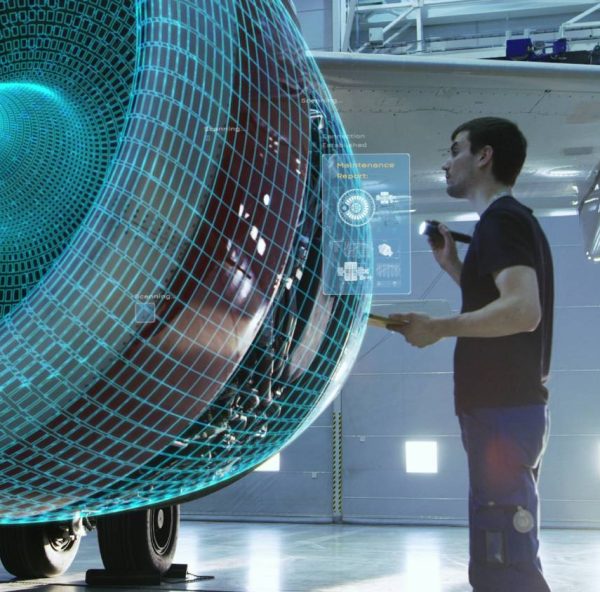
SAS has long believed that demand for people with analytics skills will continue to grow - especially given the big data challenges ahead. In fact, we love the way that Google's Chief Economist Hal Varian talks about this explosion in growth: statisticians will be sexiest job of the next decade. This
English
Several years ago my mom, bless her heart, bought a cell phone. Now, my mom is not what one would call “tech-savvy”. She has had the same car forever, same furniture for 25 years (well, she did get it reupholstered), even the same pots and pans that came as wedding
With an exponential growth in transactions, it may be hard to get a clear, single view of customer interactions. ICICI Bank , India's second largest bank, needed a single system that could replace multiple (complex to maintain) reporting systems - enterprise wide. The challenge - finding a solution to handle its growing
As rain settles in over the green fields of England, I’ve been reading the Times Higher Education (THE) periodical. It’s always a lively read, as it invariably takes the part of untenured junior lecturers in any dispute. It is also very well researched and informed. This week’s THE edition has
When I started using SAS back in 1995, every SAS user was a SAS programmer. We wrote code, and we were proud of it! We accessed our data via the DATA step, PROC IMPORT and SAS access engine code. If you had asked me back then what metadata is, I’m
While I'm waiting for the next "data intense" event to show up in the news (so I can blog some SAS graphs about it), I thought I'd share a few fun SAS graphs in the spirit of the holiday season! Please don't hold me to too high of graphical "best practices"
In a recent article on efficient simulation from a truncated distribution, I wrote some SAS/IML code that used the LOC function to find and exclude observations that satisfy some criterion. Some readers came up with an alternative algorithm that uses the REMOVE function instead of subscripts. I remarked in a
In addition to the Forest Plot with Subgroups, another popular graph in the clinical research space is the Most Frequent Adverse Events Sorted by Relative Risk graph. Recently, I worked with folks from some pharmaceutical companies to contribute SAS code for this graph to the CTSPEDIA resource for statistical graphics. The data for number
I live in the South, but was raised by Midwestern Catholics from rural Minnesota. Think Jeff Foxworthy meets Fargo. A few of the great things that I have learned about folks in the South is their incredible politeness even when they are really saying, "Wow, what in the world are
Independent contractor. Two very simple words that have a dramatic impact on businesses, workers, and government programs. While most people have a basic understanding of the term, they often have very little understanding of the laws governing it, which vary significantly program by program and state by state. This has
It seemed like an easy task. A SAS user asked me how to use the SGPLOT procedure to create a bar chart where the vertical axis shows percentages instead of counts. I assumed that there was some simple option that would change the scale of the vertical axis from counts
There are two activities which, when taken in combination, have occupied the vast majority of my working hours for the past 20 years: writing computer programs and writing...well, just writing. During my college years I completed my degree with a double-major: Computer Science and English. (My English degree has a
Collaboration can be difficult, but what if you could provide a template that helps everyone work together more efficiently? The Post-It note author below has developed such a tool and suggests using it as a guide for accepted coding standards. You can also use templates to control the look of
Apply now for the SAS Global Forum Junior Professional Award. Only 20 professionals will be selected. Congratulations to the SCSUG awardees!
If you haven’t heard of an APCD, it’s one of those acronyms you need to know. All-Payer Claims Databases are simply databases that consist of claims data from all health care payers in a given state. This includes private payers such as Blue Cross Blue Shield, and public payers such
Recently, I shared a summary of Brian Varney’s SESUG presentation on How to document your SAS environment. One important step was determining where files that control overall processing, such as autoexec.sas files, are deployed. For installations on a single server or platform, Varney suggested using the OPTIONS procedure, which lists
Frequently someone will post a question to the SAS Support Community that says something like this: I am trying to do [statistical task]and SAS issues an error and reports that my correlation matrix is not positive definite. What is going on and how can I complete [the task]? The statistical
“So, you work for SAS?” asked my co-passenger. I was on the plane to Baltimore to attend my first NESUG conference and the tag on my laptop bag was the clue. I happened to be seated next to a SAS user who was familiar with ODS Graphics. I ended up
Several weeks ago, South Carolina was the victim of what some experts believe to be the largest cyber-attack against a state tax department in history. Approximately 3.6 million personal South Carolina income tax returns were exposed, and nearly 657,000 businesses compromised, in an international hacking attack. Coincidentally, SAS and the SC
Jenine Milum is the Vice President and Analytics Manager at Wells Fargo Bank. About 10 years ago, she learned a valuable, but little known solution to cutting the CPU processing time when dealing with large data sets. "We were processing log activity for our website on a daily basis," says Milum,
Have you used the MEANS procedure to calculate frequencies: for several variables in the same step? without sorting the data first? without checking for missing values? using the TYPE statement and the CLASS statement together? At the recent SouthEastern SAS Users Group conference, Janet Willis shared what can go wrong
Last week I wrote about using acceptance-rejection algorithms in vector languages to simulate data. The main point I made is that in a vector language it is efficient to generate many more variates than are needed, with the knowledge that a certain proportion will be rejected. In last week's article,
Kirk Paul Lafler, Software Intelligence Corporation, has written four SAS books and more than 500 peer-reviewed papers - 19 of which were awarded Best Contributed Papers or Poster, so I’m going to believe him when he says that he’s figured out a thing or two about tuning SAS systems.
A recent question by a user lead led me to experiment with what is often referred to as conditional highlighting. The user wanted to display a bar chart of response by year, where each bar is colored by year, and show a cross hatch pattern on the bars where the
Have you heard the expression "Talk Turkey"? Well then, what better (tongue-in-cheek) thing to do around the Thanksgiving holiday, than talk some turkey using SAS Graphs! ;) I don't usually decorate my graphs with images and pictures (they typically make the graph more difficult to read), but when it comes
The LOC function is one of the most important functions in the SAS/IML language. The LOC function finds elements of a vector or matrix that satisfy some condition. For example, if you are going to apply a logarithmic transform to data, you can use the LOC function to find all
Most custom tasks need to access SAS data in some way. Since custom tasks are built using Microsoft .NET, and the .NET Framework is object-oriented, it would be convenient if we had an object-oriented method for navigating SAS data sources. That was the thinking behind the "SasData"-namespace classes within the
As the holidays approach, we’ll all have some down-time to catch up on personal and professional reading, hopefully cozied up by a fire with a cup of hot chocolate in hand. While most books regarding data-driven decision making and value-added analyses can be pretty heavy, I’d like to suggest two
In pharmaceutical research, analysts often want to see the number of respondents who are at each site and the treatment they receive. Apparently, there's more than one way to produce correct results when you are using the PROC MEANS procedure. In Janet Willis' paper, Do You Have Too Much Class?, (awarded Best
Are you considering submitting a paper to the SAS Global Forum? The deadline for submissions is right around the corner – here’s some ideas to help you get your paper selected! Steve Overton and Tricia Aanderud have presented papers at several of the SAS user groups and here are a