A graph in a recent article in Fortune magazine caught my eye. The graph shows the cost of hosting the Summer Olympics over the past eight events. Here is what I termed the "Medal" graph.
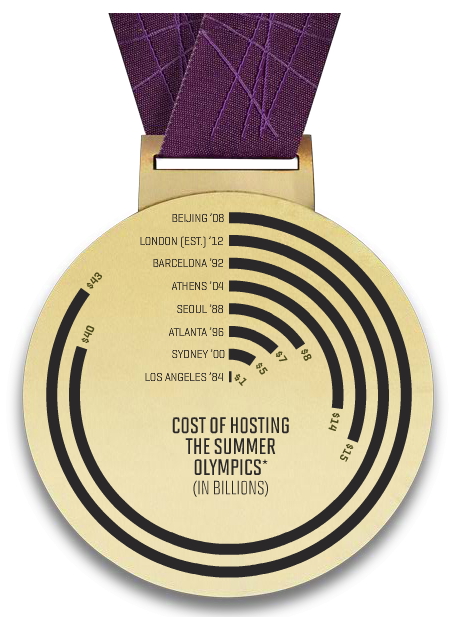
Now, practitioners of the art of Effective Graphics would likely find some shortcomings in the graph. Clearly it has been created keeping the subject matter in mind, and plotting magnitudes as angles around a circle like a pie chart leaves something to be desired.
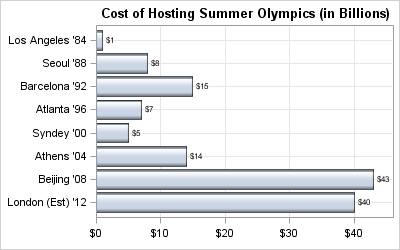
But there appears to be something amiss about this graph which will become more obvious after seeing the traditional representation of the data as a bar chart below. We'll return to this matter later in the article.
Let us take this opportunity to talk about a new feature in SAS 9.3 SGPLOT VBAR / HBAR statements called CATEGORYORDER= RespAsc | RespDesc. This feature supports sorting of the categories by the final response value of the bars. To create the graph, I created a SAS data set with two columns, one for Event name and one for Cost. Using SAS 9.3 SGPLOT procedure, here is the graph using a horizontal bar chart.
Horizontal Bar Chart in data order:
SAS 9.3 Code:
title 'Cost of Hosting Summer Olympics (in Billions)'; proc sgplot data=olympics; hbar event / response=cost dataskin=gloss datalabel nostatlabel; xaxis grid display=(nolabel); yaxis grid discreteorder=data display=(nolabel); run; |
Note, the HBAR statement in SGPLOT automatically reverses the Y axis so the first observation is drawn at the top, with subsequent ones drawn below. This is also true for the DOT plot. Also, by default, the bar chart places the axis values using an ascending sort. So, to get the bar chart above, where the the categories are in data order you have to set the Y axis DISCRETEORDER=Data. This graph provide a good view of the progression over time of the cost for holding the Olympics.
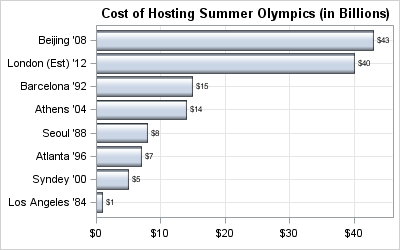
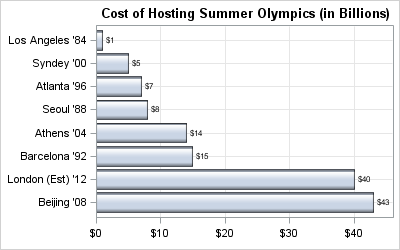
Now, let us use the new option CATEGORYORDER to order the bars in Descending or Ascending order of the bar magnitude. This feature is very useful, as the categories are ordered by the final bar response value after summarization.
Horizontal Bar Chart in Descending Order of Response Value:
SAS 9.3 Code:
title 'Cost of Hosting Summer Olympics (in Billions)'; proc sgplot data=olympics; hbar event / response=cost dataskin=gloss datalabel categoryorder=respdesc nostatlabel; xaxis grid display=(nolabel); yaxis grid discreteorder=data display=(nolabel); run; |
Here, we have set CATEGORYORDER=RespDesc to get a descending sort by response value. This graph is equivalent to the "Medal" graph. Similarly, you can set CATEGORYORDER=RespAsc to get an ascending order of the bars.
Horizontal Bar Chart in Ascending Order of Response Value:
Now, let us get back to the question I had about the "Medal" graph. Somehow, to my eyes, the longer bars representing each event seemed too long. This is particularly reinforced by comparing the Medal Graph with one of the bar charts above. In the Bar charts, the bar for Beijing (43) is about 5 times longer than Seoul (8) as expected. But, in the Medal Graph, the bar for Beijing looks inordinately long - because IT IS.
The length of each bar in the Medal graph is a combination of the angular value TIMES the radius. In this graph, it appears the angle subtended at the center is proportional to the cost. So, that part is fine. But, in this case, my eye is really drawn to the length of each bar, which gets longer as you go to the outer edge of the medal. The radius for Beijing is about twice the radius for Seoul, so now with the proportional angle, the Beijing bar (or arc) is really 10 times the length of the Seoul bar. This is borne out in the graph below, where we have normalized the unrolled length of each bar to 43 (cost for Beijing), so now the Seoul bar has a length of 4 compared with its actual value of 8.
Using equal stepping of radius from 1 to 8 (number of observations), and cost as a fraction of max cost (Beijing) , I computed the bar lengths=angle*radius and normalized it to 43 to match the Beijing cost. Then, I plotted the actual cost, and the unrolled length side by side in the graph below. I dimmed the actual cost bar to see the unrolled values more clearly.
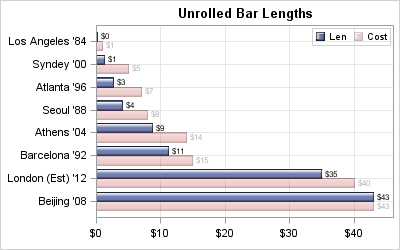
Since I normalized the unrolled length values to the Beijing cost (43) we can see the Medal graph under represents the smaller values due to the changing radius of each arc. Shields up - fire at will - Scotty - More power to the shields!
In the above graph, we have used the ability to place two different responses side by side using the DISCRETEOFFSET feature, and used TRANSPARENCY to dim one of the bars.
Full SAS 9.3 Code: SAS93_Code


6 Comments
Sanjay,
How can I create Horizontal Bar Chart in Descending Order using 9.2?
Thx,
If you use SGPLOT, the HBAR statement will automaticall reverse the Y axis, so the first data value will be shown at the top. You can sort the data in the order you want, and then use DISCRETEORDER=data on the Y axis.
Sanjay,
I am creating a vertial bar chart using ODS graphics Designer 9.3. I am trying to display my x-axis category from ascending sort (letter, office visits, telephone) to a customer defined sort (e.g., telephone, letter, office visits). How to do it? I am new to SAS ODS graphics Designer and I have been an EXCEL user making figures.
Thank you!
Sanjay,
I am using SGPLOT (in SAS 9.4) to create a stacked bar chart. Each subject has 5 visits (Visit 1,2,3,4,5). They have a total dose which is the sum of all 5 visits. My Y-axis is the total dose. The X-axis is each subject. Each stacked bar shows the total dose split up by visit. I sorted the subjects by ascending order of Total Dose. So far so good.
Now in each stacked bar, I need to keep the visits in the same order (1,2,3,4,5) instead of their dose at each visit. So right now, if visit 4 has a smaller dose than visit 1, it shows up later in the stack. I want the stack to always display visit 1 before visit 2 and so on for each subject. How can I accomplish this? Is it possible?
Thanks,
Vamsi
Sanjay,
We are using SAS 9.4 1M4.
proc sgplot data=test;
vbar subject / response=tot group=rank categoryorder=respasc;
xaxis label='Subject';
yaxis label='Total Dose';
run;
Thanks,
Vamsi
Vamsi's question was answered in the SAS Communities forum: https://communities.sas.com/t5/Graphics-Programming/Stacked-Box-Plot-sorted-by-Y-axis-variable-and-an-internal-sort/m-p/552176/highlight/true#M18007